Intro:
The SPX500 above its resistance level, some commentators (i.e the articles on marketwatch) say that the worst is over now that the S&P500 is above 2000, but look at the leaders
Who are the leaders: on Friday look at the biggest green on the map below. Secoundary leaders are other indexes: commodities, currencies or other big stocks on the map.
Charts of the leaders follow the map below in regards to resistance
Stock leaders in regards to resistance:
Secoundary leaders
Those leaders were all tech, so how is tech doing?
Conclusion
Volume up is weak.
The above slightly suggests its a sucker rally as leaders aren't above resistance like the SPX500. This game isn't about being right, its about making money. If it was anything more or less I would adjust my style accordingly. I will go short with 45 point stop-loss to 2060 or 1 week time out, whatever kicks in first. (2060 is high cause it is the SPX500 and there are stop-loss hunters).
Us newer T/A people really appreciate the fine information that is provided, as by reading and re-reading and applying the information we can all learn more as this is a difficult topic. My gut feeling Frostyboy but so much better in charts.
I've only covered half my position with a loss. I will let it play out some more due to the following:
On Friday the SPX, NASDAQ and DOW broke above its resistance but leader components and indexes of other markets didn't i.e the futures for ASX and LSE this is divergence.
SPX500 break above resistance could be fake as:
1. The SPX500 trading on Thurs and Friday looked like short covering.
2. It was options and futures expiration on Friday so prices can be manipulated.
The SPX500 Advance/Decline and stocks above moving averages are true (no divergence)
This week bulls and bears are going to do some serious battle. There are going to be alot of earnings reports. I don't like to look for the catalysts. I like to look for the divergences, when there are enough any catalyst will do.
It was hard writing my post last night...The TA was showing bullish signs of a resistance breakout yet as I was writing the Wall St futures (-0.4%) were tanking down from the 1996 resistance..
..but as usual in times of upset Mother Yellen comes to the rescue with a cuddle and soothing words..
Well... Wall St knows the earnings may be under pressure with this reporting round due to kick off.....Alcoa a lightweight metals manufacturer is the first kid of the block and came in with a poor
result after the market closed..Alcoa futures dived down..The chart shows Alcoa as a cyclical stock presently struggling to get itself out of a newly formed trough..
Hmmm I wonder how Mr Market is going to react to the possibility of a poor reporting period
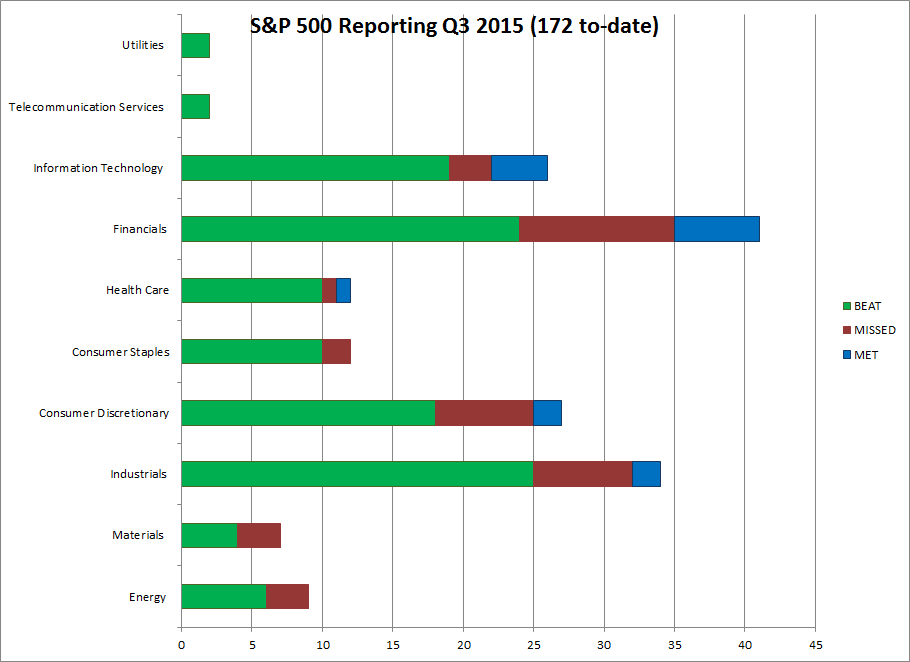
Q3 reporting data is coming through now and the reason for the rally is fundamental.....Many influential number cruncher's crystal balls were expecting a temporary fall back of earnings for Q3
and Q4 then earnings forecasted to move up again in 2016...Mr Market duefully topped out and corrected / cyclically reversed on this forecasted earnings fall scenario...however even the most
respected crystal balls can not predict the future and Mr Market had to turn around and correct again when the Q3 data started to show a surprising number of companies with better than
forecast results..


 Reply With Quote


Bookmarks