-

 Originally Posted by frostyboy

Hmmm ..they are all near their respective resistance levels...
Frosty boy I had to add www. in front of your urls to open them
-
Member


Originally Posted by Hoop
Hmmm ..they are all near their respective resistance levels...
Frosty boy I had to add www. in front of your urls to open them
Sorry about that image thing.
If the SPX500 is just above its resistance level, but the leaders are just below their resistance levels, the SPX break up is a fake out.
I saw this in phase 1 of bear 2007/2008 when the SPX500 did a rally to 1458 ,finishing with a spinning top above resistance level that a few turned bullish at. Today the leaders are more of a mixed bag in regards to resistance compared to 2007/2008.
AT 1986 I covered half of the shorts I was holding, which now looks to early(1983)
-
Yes Frostboy the fake out when the bulls apply their limited buying pressure to get the index past that resistance point which defines the sucker rally...
Looking at the S&P500 from another angle
Have a look here Frostyboy.....http://stockcharts.com/freecharts/gallery.html?$NYA200R.
NYA200R is the NYSE percent of stocks above their MA200...presently, its rather low (28%) as expected (For those in the Bull cycle camp, its not unusual to see <10% during a decent bull market correction). The NYA200R seems to be rallying again after its throwback to test the bottom (15.74%)....Observe the bullish island on the Candlestick weekly chart....Beneath is the PF chart which shows a breakout....but the target marked in as of "now" is 48%, this is a lower high, indicative that the new rally could be the sucker variety usually associated with cyclic Bear market cycles....That P&F 48% target would translate to about 2040/60ish...A bit higher than Ananda's 2020 intra day peak resistance and the 2035 gap resistance area..
But before the above scenario can happen, the S&P500 has to jump a very large hurdle (~1996)...but if it does go north of 2000 we could see that point in time when the Bear cycle brigade will have to endure a period of noisy Bulls chanting I told you so...
Last edited by Hoop; 08-10-2015 at 10:12 PM.
-
Im not chanting yet but.... S&P is above 2000 
-
Last edited by Hoop; 09-10-2015 at 09:39 AM.
-
Originally Posted by Hoop

It was hard writing my post last night...The TA was showing bullish signs of a resistance breakout yet as I was writing the Wall St futures (-0.4%) were tanking down from the 1996 resistance..
..but as usual in times of upset Mother Yellen comes to the rescue with a cuddle and soothing words..
Well... Wall St knows the earnings may be under pressure with this reporting round due to kick off.....Alcoa a lightweight metals manufacturer is the first kid of the block and came in with a poor
result after the market closed..Alcoa futures dived down..The chart shows Alcoa as a cyclical stock presently struggling to get itself out of a newly formed trough..
Hmmm I wonder how Mr Market is going to react to the possibility of a poor reporting period
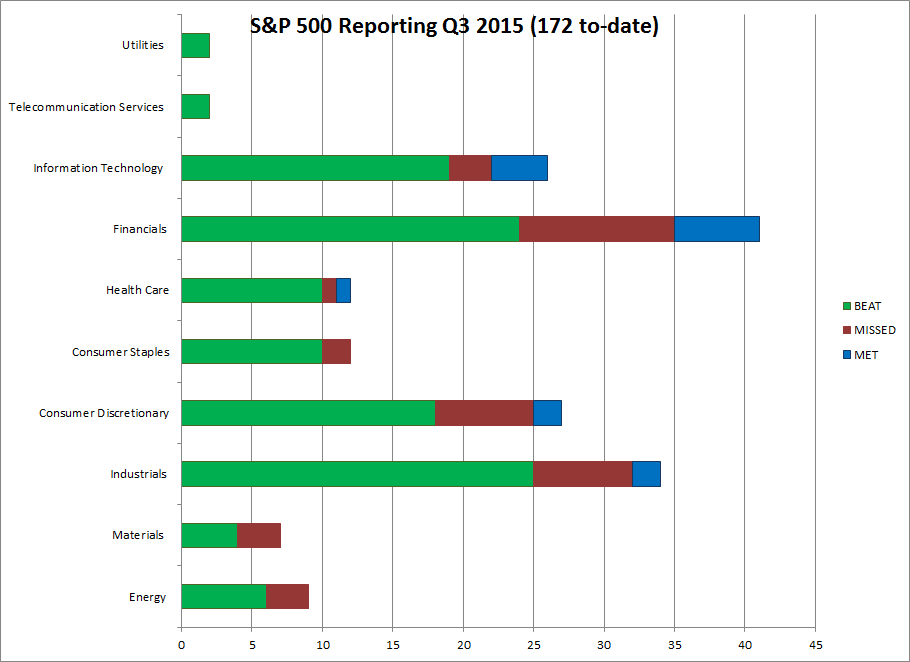
Q3 reporting data is coming through now and the reason for the rally is fundamental.....Many influential number cruncher's crystal balls were expecting a temporary fall back of earnings for Q3
and Q4 then earnings forecasted to move up again in 2016...Mr Market duefully topped out and corrected / cyclically reversed on this forecasted earnings fall scenario...however even the most
respected crystal balls can not predict the future and Mr Market had to turn around and correct again when the Q3 data started to show a surprising number of companies with better than
forecast results..
the diagram from Colin Twiggs linked article http://goldstocksforex.com/2015/10/25/sp-500-reporting-in-full-swing/
Last edited by Hoop; 30-10-2015 at 10:38 AM.
Reason: Resize to fit window
-
-
-
Originally Posted by Baa_Baa
Yes..A good analysis..Baa Baa
-
 Posting Permissions
- You may not post new threads
- You may not post replies
- You may not post attachments
- You may not edit your posts
-
Forum Rules
|
|


 Reply With Quote
Bookmarks