-
06-10-2010, 10:32 AM
#601

 Originally Posted by ananda77

The Inverted Head & Shoulders on the S&P ...
A Rare, opposing Double Head & Shoulder pattern?
...projection of inverted H&S = SPX 500 *1244
At the same time, the normal orientation H&S pattern:
...right shoulder resistance SPX 500 *1156.40
SPX 500 hit 1156.80 Thursday September 30 and pulled back
Market Minestroni:
Fed pumps liquidity_USD close to support/reversal level_important VIX RSI positive divergence duress condition still unresolved
Kind Regards
Yes Ananda
Did you notice the same inverted H&S on the NZX50 plus most of the other major indexes on my latest Goldilocks and the 3 bears thread post. Notice how those formations are at a later stage than the S&P500 and some are so advanced as to nearing completion..All good news for the S&P500 as this confirms the beginning of this latest rally is probably ongoing for a little while yet.
A forecast as to a possible direction is to look at the 2 most advanced indices, the FTSE 100 and NZX50 that have the same similar simple H&S formation and compare those 2 with the S&P (Shanghai the leading index has a atypical H&S formation and hard to recognise, it is very tilted).
For the S&P500 to break back from a bull trend into the resumption of the Bull market cycle the FTSE and NZX50 will get there first before the S&P500.....so the figures to watch are the breaking of primary resistance levels.
FTSE .......5840
NZX50......3340 / 3350
Notice how the NZX50 reacted to the Europe/USA huge 1.5% - 2.5% rally...the NZX50 has hit a resistance level 3240 which it has been struggling to crack for the last fortnight..hence a small rise of only 0.5% today after hitting that 3240 at opening and respecting.
FTSE related resistance level is the 5640 which it has failed to crack last night...it too has has been try to crack this level for 2 weeks now as well
The SP500 related resistance level to that of the FTSE/NZX50 seems to be the 1175 level, if it is the SP500 could hang around this level for a week or so as well, trying to crack it.
If the NZX50 / FTSE100 fail to crack their related resistance levels and downtrends then there's an excellent chance the S&P500 will fail as well about 3 weeks later.
Formation hypothesis has it... they shouldn't fail, and continue to uptrend to meet their respective H&S formation target prices ( Those high points experienced last April)
Last edited by Hoop; 06-10-2010 at 11:15 AM.
Reason: Added extra info
-
06-10-2010, 11:30 AM
#602

Hi Hoop,
The SP500 related resistance level to that of the FTSE/NZX50 seems to be the 1175 level
...agree, that's the crunch point where the index may roll over in the short term for a nice correction
Kind Regards and thanks for your contribution on all the other indexes (saves me a lot of time just reading your updates)
Trader Update -data point 05 October 2010:
...the SPX 500 moved away from the September 28 Low *1132 decisively and started to rally well above key near term support from September 23 Low *1123 to a new 3-month High *1161
...considering the bullish sentiment in the market, the next expected target for this current advance is the May 13 High *1174 before risk of a bearish reversal near this overhead resistance is on the increase
Kind Regards
Last edited by ananda77; 06-10-2010 at 06:19 PM.
-
07-10-2010, 08:22 AM
#603
-
07-10-2010, 10:39 AM
#604

Looking forward to Friday morning's employment report. If it comes in "better than expected," it is supposedly bullish for stocks because it signals that the economy is getting better. If it comes in "worse than expected," it is supposedly bullish for stocks because it will then mean that the Fed will undertake QE2
Its a win win situation guys.... what choice but go long! 
For clarity, nothing I say is advice....
-
08-10-2010, 10:07 AM
#605

...www.stocktiming.com: -data point 07 October 2009-
...Institutional Core Holding  -bullish above 3-year resistance- potential risk: right shoulder still a possibility below left sholder top (RS)
Trader Update -data point 07 October 2010:
…Long term Fed and Foreign liquidity inflows  still ticking up while the USD edges closer to long-term 75/76 support still ticking up while the USD edges closer to long-term 75/76 support
...in a round of profit taking, the SPX 500 dived back to intraday *1151 after the opening rally bumped into overhead resistance levels *1164_*1175
…despite the intraday set-back, downticks caused no damage so far and as long as liquidity levels continue to rise, potential for additional upticks could drive the index to a challenge of the May 13 High *1175
...failure in the *1175 range would set the stage for a bearish reversal with 3-month trendline support *1142 as an initial target with potential to test key support levels in the *1120 range
Kind Regards
Last edited by ananda77; 08-10-2010 at 10:08 AM.
-
10-10-2010, 10:44 AM
#606

Consensus view? The collective prognostications of a bunch of self-styled "experts" that don't know any more than you or I do?
Who gives a toss what the pundits think - it's what the market thinks that counts, and right now it is booming.
You cash up any time you like Belg, but while the market is so strong, I want to be 100% invested.
Think of it as traffic lights. When the light is green, you GO. It is only when the light turns red that you should give some thought to stopping!

-
10-10-2010, 05:01 PM
#607
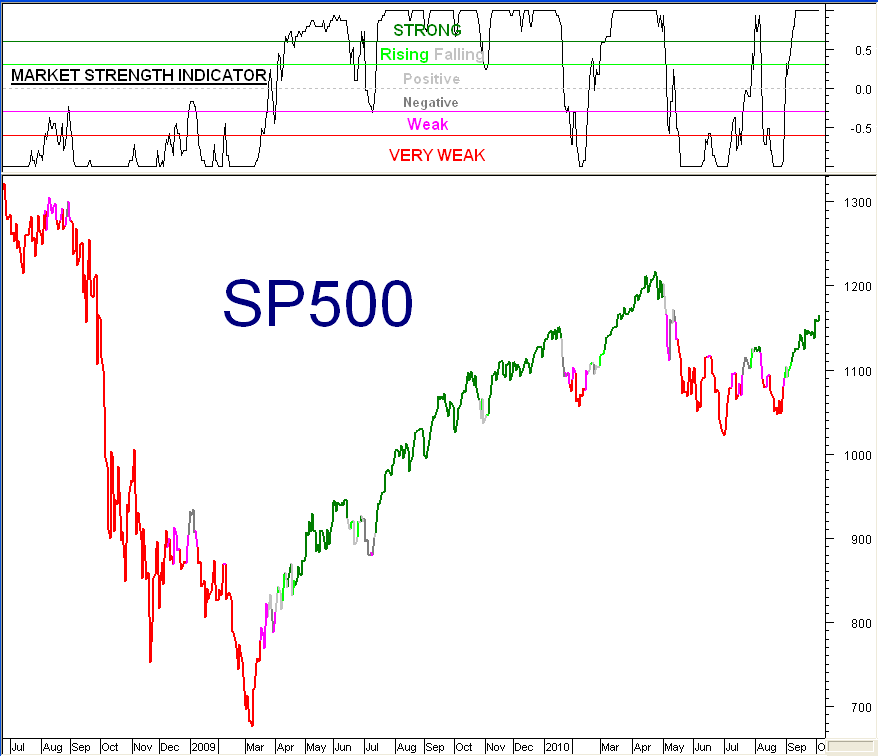
 Traffic Light market signals. Traffic Light market signals.
Me? I get ready to stop.
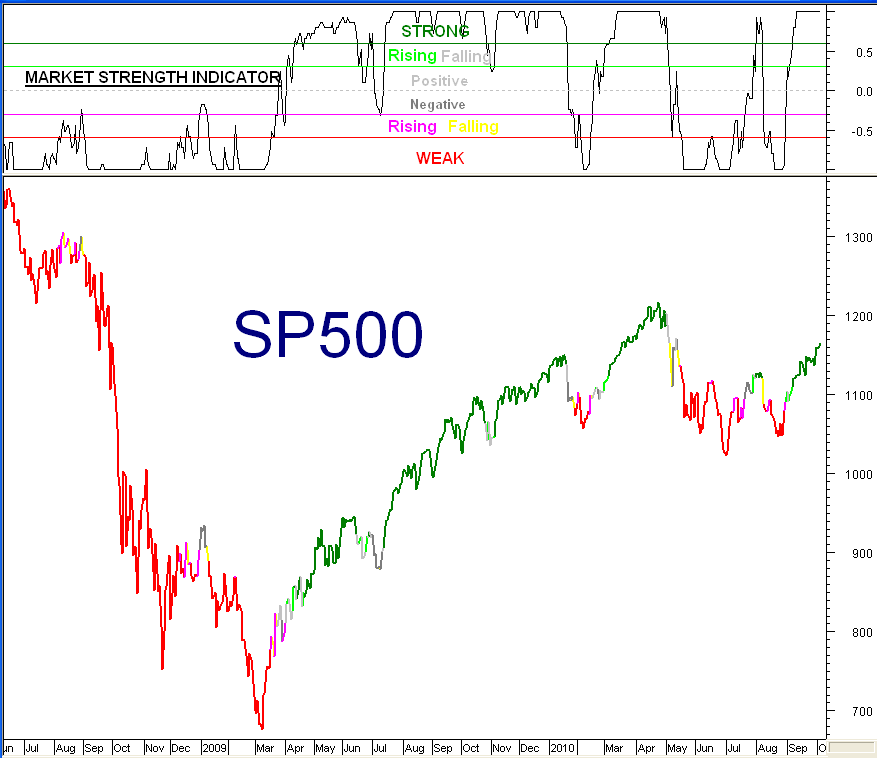
If you want to pursue the traffic light analogy further, here is a chart with a yellow phase as the nearest equivalent to amber that I can offer.
For me, this would mean no buying and that all Sell signals must be acted on.
Of course, devout contrarians would be buying at just such a time. You can see from the chart below just how well that approach works!

-
10-10-2010, 05:47 PM
#608

 Originally Posted by belgarion

Belgarion:
...liquidation of short position of larger market participants started in earnest throughout September and accumulation in earnest in late September and continued into the first 10 days of October; this fits with the longer time frame showing further upside potential. although the shorter time frames are struggling to keep up-momentum going
...there is no doubt that the market sentiment remains bullish at present and all we may see are shallow pull backs on the way past the April SPX 500 High *2019 into the *1300 range later this year or early 2011
...anyway, fortunately the market is not a one way street, money flows in both directions
Kind Regards
Last edited by ananda77; 10-10-2010 at 06:09 PM.
-
12-10-2010, 08:58 AM
#609
-
13-10-2010, 05:00 PM
#610

Trader Update -data point 12 October 2010:
...the SPX 500 dived back intraday *1156 but recouped losses quickly and closed higher *1170 amidst a bullish bias in daily market internals
…again, downticks caused no damage so far and as long as liquidity levels continue to rise, potential for additional upticks could drive the index to a challenge of the May 13 High *1175 and higher *1189 overhead trendline resistance would not come as a surprise either
...failure in the *1175/*1189 range would set the stage for a bearish reversal with 3-month trendline support *1144 as an initial target
Kind Regards
 Posting Permissions
- You may not post new threads
- You may not post replies
- You may not post attachments
- You may not edit your posts
-
Forum Rules
|
|


 Reply With Quote

 still holding the support with a danger level of 24.34
 warns of a pending bearish reversal

 -bullish above 3-year resistance- potential risk: right shoulder still a possibility below left sholder top (RS)
  still ticking up while the USD edges closer to long-term 75/76 support


 could play out with a Close above *1174 needed as confirmation
Bookmarks