-

Ichimoku signals seem to perform relatively poorly in the presence of a long-term uptrend. I wonder if it is no accident that it is most widely used in FX trading where longterm trends are practically non-existent. Just a theory.
Keep in mind that in the presence of a steady uptrend, it is pretty much impossible to beat a "Buy and Hold" approach anyway.
It is also possible that Ichimoku provides a superlative "one glance cloud chart or more appropriately Instant view of the balance chart" even though its specific Buy/Sell signals may be mediocre and can be outperformed by other systems. Maybe it works superbly on FX but not so well on stocks.
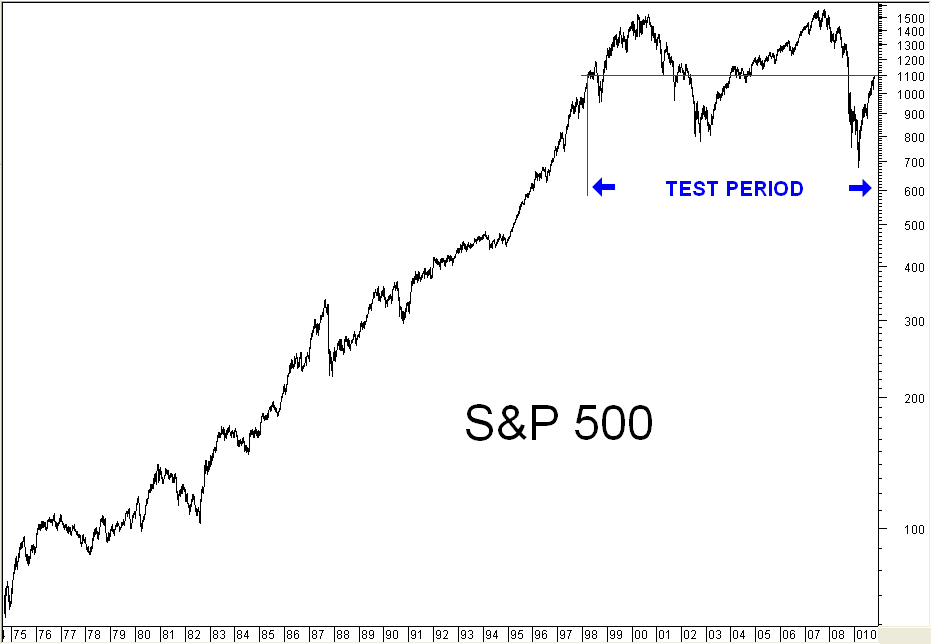
It is very difficult to evaluate this system when its performance characteristics vary so widely depending on the backtest period and what you are back-testing it against. In an attempt to remove the "longterm trend bias" I have been backtesting the SP500 on the period as marked in this chart, such that "Buying and Holding" gave zero return over nearly 12 years. Over this period, acting on all Ichimoku signals gave a loss of 25%, while acting only on Strong signals gave a gain of 20%.
Re the NZSX50 test data, to me it seems very odd indeed that by ignoring the "weakest" signals, the return collapses from an already poor 75% to just 32%. The conclusion that under these test conditions "weak" signals are no weaker than "strong" signals seems inescapable. Since this distinction is mediated by the relative position of the Kumo cloud, this in turn casts some element of doubt on the validity or worth of this concept when applied to Indices or stocks.
Time for me to begin backtesting some stocks, I think.
Afterthought :- Am I struggling to re-invent the wheel here? Does anyone know of any definitive, authoritative statistics as to the profitability of Ichimoku as applied to stocks?

 Posting Permissions
- You may not post new threads
- You may not post replies
- You may not post attachments
- You may not edit your posts
-
Forum Rules
|
|


 Reply With Quote
Bookmarks