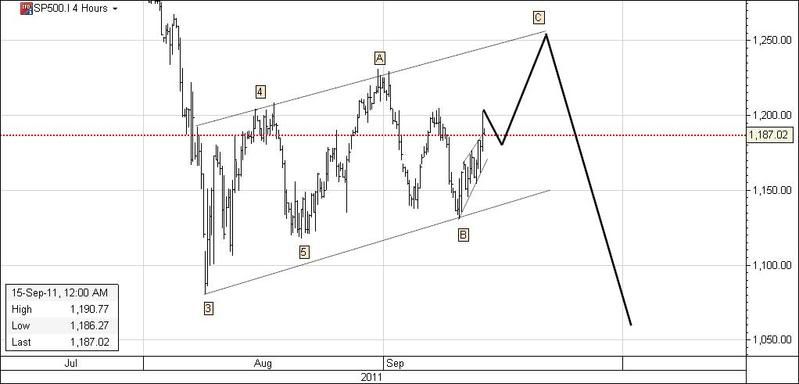
im not sure what your looking at hoop , looks like a tradeable bear flag to me.
Ahhh...I see our differences
You work off the lowest and highest and I work off closing day figures.
Now...you people can see how complicated TA can be ...if you ask 5 people to draw a simple trendline I betcha you will get 5 different lines
Who's right how's wrong? It not worth the argument.
The reason I use closing day figures on a daily chart is it lessens the "noise" ...and....when you go longer than a year you can't decipher Candlesticks or OHLC and daily charts revert to solid closing day lines anyway. Therefore I keep to the same trendline criteria discipline....for obvious reasons I do realise I can't do this on short term and very short term charts.
Working off weekly and monthly lessens the "noise" again for longer term analysis...but the criteria is different so its another chart discipline.
but...I will probably be at a disagreement with many short term traders on this method.
In defense to closing day highs notice on my post #1023 chart above my near horizontal bottom line is validated by 4 closing day touches + 2 lowest day lows... Dumbass your upward sloping bottom line isn't validated
Each to their own and its best to keep using the discipline that works best for you........and in most to nearly all cases the deduction got out of these slightly different patterns usually ends up with the same forecast


 Reply With Quote


Bookmarks