


Snoopy I guess the next thing to work out is the intrinsic value.
>>>>>>
from http://en.wikipedia.org/wiki/Benjamin_Graham_formula
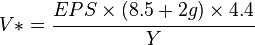
The Graham formula proposes to calculate a company’s intrinsic value V* as:
V: Intrinsic Value
EPS: the company’s last 12-month earnings per share
8.5: the constant represents the appropriate P-E ratio for a no-growth company as proposed by Graham
g: the company’s long-term (five years) earnings growth estimate
4.4: the average yield of high-grade corporate bonds in 1962, when this model was introduced
Y: the current yield on AAA corporate bonds
To apply this approach to a buy-sell decision, each company’s relative Graham value (RGV) can be determined by dividing the stock’s intrinsic value V* by its current price P:

An RGV of less than one indicates an overvalued stock and should not be bought, while an RGV of greater than one indicates an undervalued stock and should be bought.
>>>>>>
so again with telecom nz
g: the company’s long-term (five years) earnings growth estimate= 2007 ernings -2003 ernings / 5=8%
from http://www.nzx.com/market/debt_summaries
4.4: the average yield of high-grade corporate bonds in 2007= 8.61
Y: the current yield on AAA corporate bonds= 8.56
so then we have...
I am not sure how accurate this method is, but I guess it gives a relative valuation that one can compare against the share price and ROE.Code:2001 2002 2003 2004 2005 2006 2007 643 -188 704 775 806 2656 3024 Net profit after taxes 614 670 709 775 806 820 955 Adjusted net earnings 5403 5537 5199 5360 5605 5555 5582 Operating Revenue 7421 7500 7755 8246 8972 6203 8276 Total assets 2003 1328 1776 2617 2612 1062 3604 Total Equity 30.65 50.45 39.92 29.61 30.86 77.21 26.50 ROE (du point) 32.10 -14.16 39.64 29.61 30.86 250.09 83.91 ROE 0.364 -0.101 0.376 0.392 0.47 0.22 1.58 EPS 0.08 0.08 0.08 0.08 0.08 0.08 0.08 g 8.56 8.56 8.56 8.56 8.56 8.56 8.56 y 8.61 8.61 8.61 8.61 8.61 8.61 8.61 4.4 3.17 -0.88 3.28 3.41 4.09 1.92 13.76 V 4.17 4.66 4.93 5.67 5.92 4.35 4.47 Share Price (01 sep) 0.760 -0.189 0.664 0.602 0.692 0.441 3.079 RGV
What other methods available to do similar valuation?


 Reply With Quote
Bookmarks