-
26-09-2010, 03:26 PM
#1011

 Originally Posted by Phaedrus


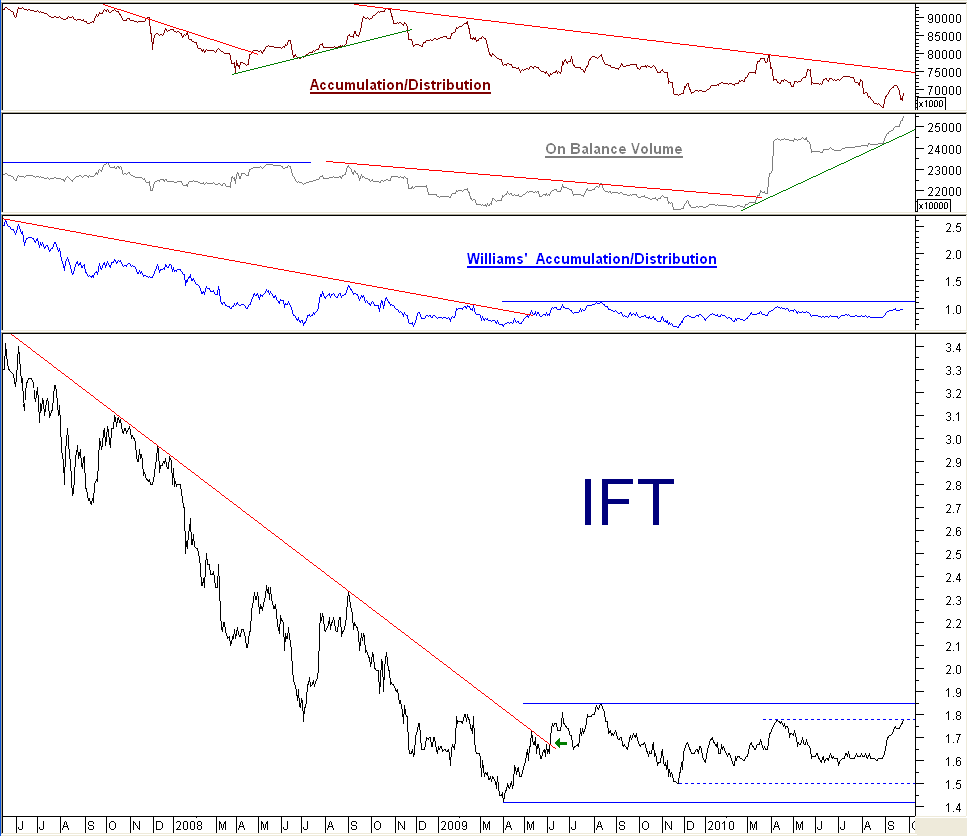
IFT remains in the trading range that it has been in for a long time. On Friday IFT closed at a previous resistance level, but a break above this should not generate excitement. A break above $1.85, though, would mean the end of the trading range and the end of a downtrend that has run for years.
Note the (unconfirmed) "buy" signal at the trendline break (green arrow). A reminder (just in case you needed one) that the break of a downward trendline does not necessarily mean the beginning of an uptrend or even the end of the downtrend.
The 3 plots at the top of the chart are commonly used volume indicators. What is interesting here is just how different they are. Right now the OBV is rising, the Williams' A/D is flat and the A/D is falling. Which one are we to believe? Given such a variation, the answer is none of them. Nevertheless with IFT over the past few years it is quite obvious that the Williams' version of the A/D oscillator has proved to be superior to the OBV that I generally use.
Personally, I am very happy to be out of IFT at the moment. There is no telling how long it will continue to crab sideways like this.
Phaedrus: Thanks for the dash of cold water - ouch! So, the OBV does have its obvious limitations. I do look at the normal Accumulation/Distribution chart but only occasionally at Mr. Williams' version.
I shall just continue to hold, meantime. (Bought only recently).
-
26-09-2010, 03:32 PM
#1012

I can't think of a single indicator (or system!) that doesn't have obvious limitations, Colin.
-
27-09-2010, 04:53 PM
#1013

my question re Phaedrus's chart is that the trading range channel lines in blue only have 1 price intersection point therefore to me they arent really trendlines to be broken (perhaps they were'nt meant to be)
up more today...
I see that AMP declared their hand last week as the large purchaser , presumably them picking up another million this morning first thing.
For clarity, nothing I say is advice....
-
27-09-2010, 05:35 PM
#1014
Member


 Originally Posted by peat

my question re Phaedrus's chart is that the trading range channel lines in blue only have 1 price intersection point therefore to me they arent really trendlines to be broken (perhaps they were'nt meant to be)
I was wondering about that too. I thought it interesting that you had drawn sloping lines while P. had horizontal lines. Any significant reason for the difference? Or are both methods merely meant to be complimentary?
I wouldn't consider IFT to be a trading stock, but I certainly enjoy the perspective TA can provide.
-
29-09-2010, 10:13 AM
#1015

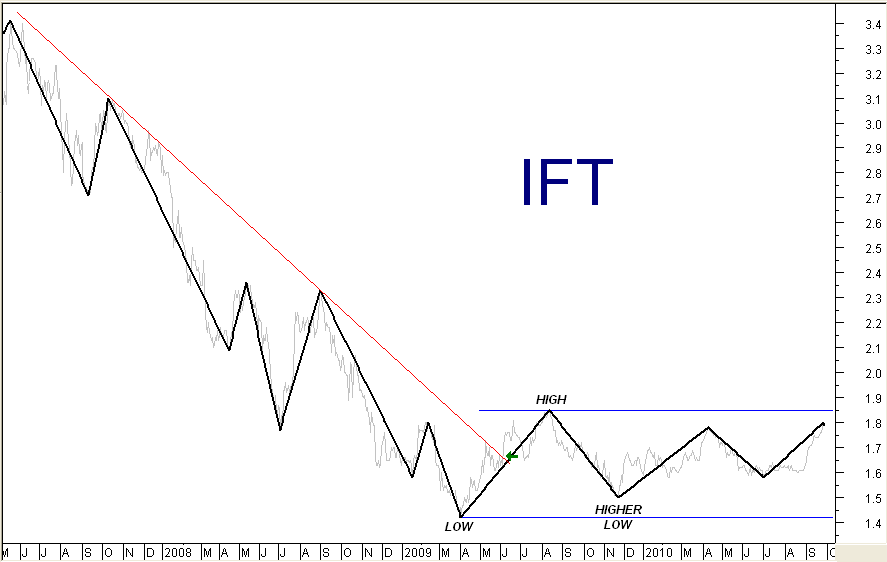
If we reduce the current IFT situation to its simplest possible construction, the importance and relevance of the blue horizontal lines is more apparent.
For the first 2 years of the chart, IFT was making a series of lower lows and lower highs in an obvious downtrend. (The red line is the "zig-zag" indicator which makes underlying patterns easier to see by ignoring market "noise" - small price changes of no significance.) Technically, a trend is deemed to be in existence until it is supplanted by the reverse trend. In this case, to end the "longterm" downtrend, IFT must begin an uptrend which requires it to make a Higher High after a Higher Low. We can see that for the first time in years it has made a Higher Low, but this is yet to be followed by a Higher High so technically, IFT is still in a Downtrend. To break the downtrend by starting a new uptrend IFT needs to break above $1.85. This crucial level is marked by the upper blue line. This is not a trendline and requires no confirmation
IFT has been crabbing sideways in a trading range for about 18 months, so far. A break above $1.85 will end the trading range, end the long downtrend, and would constitute a Buy signal. A break below $1.42 would re-confirm the existing longterm downtrend and would constitute a Sell signal for those that bought at the trendline break (green arrow). This critical level is marked by the lower blue line - again, this is not a trendline.
As IFT meanders along between these 2 crucial levels, all sorts of uptrends, downtrends, oscillator signals and patterns (such as the triangle noted by Peat) are being created. While these are of great interest to those attempting to trade IFT, they have no relevance for trend-followers.

-
12-10-2010, 08:57 AM
#1016

Article From ShareChat
Infratil's Greenstone Energy has made an encouraging start since it bought its 50% share in April, says First NZ Capital analyst Rob Bode.
Infratil and the Guardians of New Zealand Superannuation bought Greenstone, which owns petrol stations, 17.1% of the New Zealand Refining Company and 25% of Fly Buys, from Shell.
Bode has revised his assumptions for refining and retail margins which has boosted his estimate of Greenstone's contribution to earnings by about 20%.
Bode says the $210 million purchase price was "a very attractive price, being highly positive to cashflow, immediately earnings accretive and with significant potential for value to be added."
Initially, he had valued the Greenstone stake at $278 million but now values it at $312 million.
While this increase "may seem aggressive in such a short period, we note that on our revised estimates the purchase price represented (an enterprise value to 2011 operating earnings) multiple of just 4.1 times. We think Infratil picked up a bargain."
Bode says Infratil Energy Australia "probably offers the most potential within Infratil's portfolio for capital growth but delivery has not matched potential" and the business is not without its challenges. Any meaningful re-rating of Infratil shares "will probably hinge on convincing investors that value exists and growth is sustainable."
He values the shares at $2.39 and says they are trading at an excessive discount.
Recommendation: Outperform.
By Jenny Ruth
Monday 11th October 2010
Encouraging article, I'm waiting/hoping for a correction around the $1.60's before buying in.
-
12-10-2010, 09:45 AM
#1017
Member


Fisher just topped up on IFT as well
-
12-10-2010, 01:27 PM
#1018

This is one NZ share that is long overdue for a rerating upards. Might not happen today or tomorrow , but it will happen
-
21-10-2010, 11:24 PM
#1019
Member


 Originally Posted by belgarion

1.82 today ... The suspence is killing me. 
Slowly ticking away....
-
22-10-2010, 02:36 PM
#1020

 Originally Posted by belgarion

And whack! Buyers rush to take out every seller at 1.83.
Slowly grinding up to $1.85 that Phaedrus mentioned a while back.You may get there yet belgarion
Tags for this Thread
 Posting Permissions
- You may not post new threads
- You may not post replies
- You may not post attachments
- You may not edit your posts
-
Forum Rules
|
|

Bookmarks