-
14-07-2010, 05:18 PM
#361

Certainly seems to have sparked up.The chinese ann about reducing export quotas seems to have lifted sp.
http://www.asx.com.au/asxpdf/2010070...vh3ygwwyqr.pdf
From a TA perspective when will the sp be overbought?
-
15-07-2010, 10:30 PM
#362
 Originally Posted by Phaedrus

FT charts are pretty good. They are one of the best free charting sites and offer useful things like trendlines and indicators with user defined infinitely variable parameters. All the indicators that I regard as essential are there, plus a few more. I'll be interested in how long you stick with the MACD, Colin - I gave up on it decades ago. It is quite a popular indicator though, for all that. Backtesting it against LYC since mid 2007 gives the following results :- 27 trades. 8 wins. 19 losses. At one stage it gave 8 consecutive losing trades.
I'm quite happy to shoot the MACD indicator down in flames, Colin, but not you. I applaud your new endeavours and may perhaps be able to help you from time to time.
Thanks, Phaedrus, and I will keep your offer in mind.
Obviously the MACD indicator is one to approach with caution.
-
15-07-2010, 10:49 PM
#363
Originally Posted by stevo1
From a TA perspective when will the sp be overbought?
Well the Slow Stochastic appears to have now moved into the Overbought Zone but I still feel a bit like a child who has been handed a shotgun for the first time and told to go out and shoot rabbits - so I would prefer Phaedrus to comment on this question, if he wouldn't mind? Thanks, P.
-
16-07-2010, 10:04 AM
#364
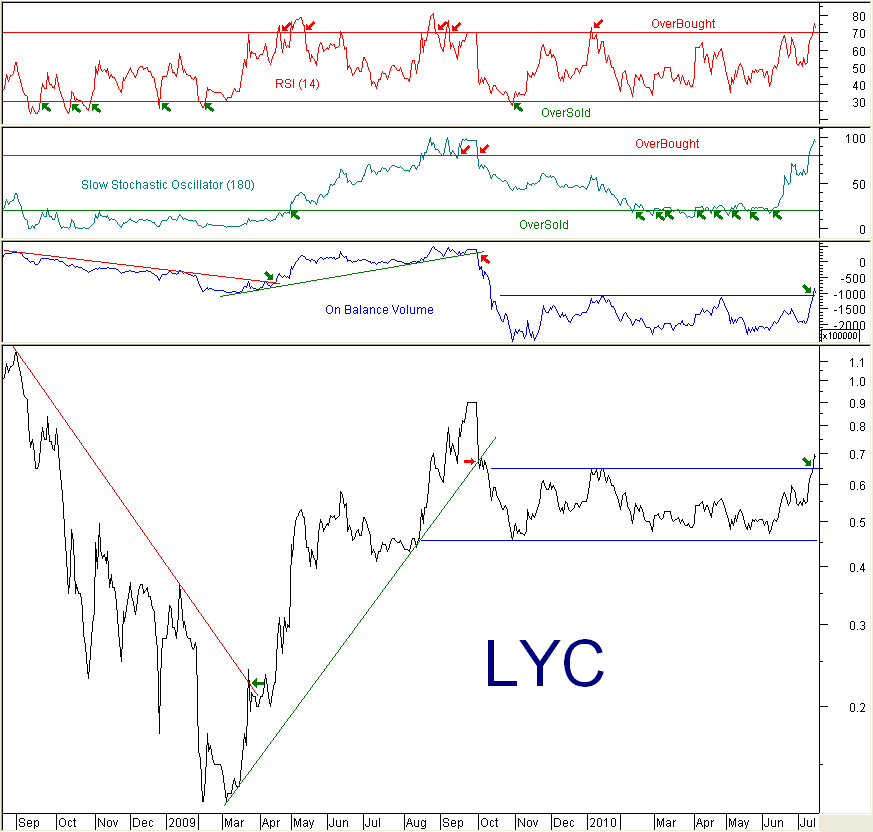
LYC Chart
Originally Posted by stevo1
From a TA perspective when will the sp be overbought?
Commonly used thresholds are an RSI over 70 or a Stochastic over 80. It is important to realise that "overbought" is a purely relative term and whether a particular stock is overbought or not will depend on the period used as well as the threshold.
Using the right tool is important. It's fine for Colin to go off shooting rabbits with a shotgun but an M16 or a paintball gun would be inappropriate, just as his shotgun would be unsuitable for deer stalking. You need to be clear as to your objectives. Are you a trend-follower that wants to keep out of trading ranges? Do you want to monitor the trading range with a view to buying any breakout? Do you want to actively trade the trading range? These very different objectives require different tools, different weapons.
First off, LYC was in a downtrend and therefore needed to be monitored by trend indicators such as the trendline shown here. See how the RSI oscillator fired off a string of misleading "buy" signals as the downtrend progressed. LYC kept reaching "OverSold" levels all the way down, but this was only to be expected and meant little or nothing.
LYC then reversed and went into an uptrend. Similarly, this required monitoring by trend indicators rather than an oscillator like the RSI(14) which fired off a string of misleading "sell" signals as LYC periodically became "overbought" as the uptrend continued - again, just as you would expect. Now, oscillators can be "detuned" to make them less sensitive and more useful for monitoring trends by increasing their time period. This is what has been done here with the Stochastic oscillator. Normally used with a 5 day time period, the Sto is a very fast, very active indicator. Used with a long time period such as 180 days as shown here, it acts a little more like a trend indicator.
Having fired off multiple Sell signals, LYC then went into a trading range. Now the use of trend indicators is inappropriate and oscillators become really useful. This chart is not optimised for range-trading, but nevertheless there are useful signals generated. (green arrows are buy signals, red arrows sell signals) See how the RSI(14) works well, but needs a shorter period to be more profitable. See how the Slow stochastic gave a string of "buy" signals suitable for those wanting to accumulate LYC. See how it was no good for trading, though. No sell signals were generated - this would require a shorter period.
So, Stevo, that was an interesting question, but the answer (LYC is technically "OverBought" right now) is not all that important. To be "overbought" does not make a stock a "sell" - or a buy.
-
16-07-2010, 05:28 PM
#365

Thanks for your wisdom on that Phaedrus it is somewhat lost on me as there are several stocks I am in a hold mode on.Though not in love with them the underlying story is just too compelling for me.Incredibly useful info for trading many thanks for the reply.
-
26-07-2010, 07:23 PM
#366
Starting to gain momentum the penny is starting to drop just how essential and valuable REE s are to the future.
-
26-07-2010, 08:04 PM
#367
Originally Posted by stevo1
Starting to gain momentum the penny is starting to drop just how essential and valuable REE s are to the future.
Yes, Steve, and all this gives me added confidence as to using T/A indicators. But, being already of a "certain age", I don't think I have enough years left to become an expert. I did notice from one of Phaedrus' postings (above) that he mentions having abandoned use of one of the indicators "decades ago", which seems to indicate that he has been a mighty long time in the T/A game; thus his tutorials are well worth effort to try and follow.
The main characteristic I fall back on these days (apart from the trend graphs) is the relative buy/sell strength of any share I am assessing. It has proved a most fruitful tool, often forcing me to abandon favourite stocks that I have clung to for too long; but the rewards can be great if the proceeds are redirected into strongly supported risers.
Last edited by COLIN; 26-07-2010 at 08:06 PM.
-
06-08-2010, 11:27 AM
#368
Originally Posted by COLIN
Yes, Steve, and all this gives me added confidence as to using T/A indicators. But, being already of a "certain age", I don't think I have enough years left to become an expert. I did notice from one of Phaedrus' postings (above) that he mentions having abandoned use of one of the indicators "decades ago", which seems to indicate that he has been a mighty long time in the T/A game; thus his tutorials are well worth effort to try and follow.
The main characteristic I fall back on these days (apart from the trend graphs) is the relative buy/sell strength of any share I am assessing. It has proved a most fruitful tool, often forcing me to abandon favourite stocks that I have clung to for too long; but the rewards can be great if the proceeds are redirected into strongly supported risers.
I would imagine at the current SP your TA indicators would be looking good Colin,I expect the SP to go a lot higher than this and I base that purely on the LYC product and company and its place into technology of the future (now).I should imagine it is a great trading opportunity perhaps not at current SP but on pullbacks.
-
09-08-2010, 01:40 PM
#369

Still moving up,I am very surprised there seems to be not that much interest on sharetrader in this stock I would have thought that a lot of people would have been all over LYC as a short term trade.I am holding long term.High so far today 91.5 cps
-
09-08-2010, 11:09 PM
#370
Originally Posted by stevo1
Still moving up,I am very surprised there seems to be not that much interest on sharetrader in this stock I would have thought that a lot of people would have been all over LYC as a short term trade.I am holding long term.High so far today 91.5 cps
I share your puzzlement, Steve. A number of what I would regard as experienced subscribers seem to get fixated on trying to whip along a few very reluctant nags (such as CFE, VPE, etc.) while sleek fillies such as LYC shoot past them. (I'm going to get into trouble here, I can see it coming!)
The On Balance Volume chart for LYC speaks volumes (hope I can be excused the pun!).
Last edited by COLIN; 09-08-2010 at 11:19 PM.
 Posting Permissions
- You may not post new threads
- You may not post replies
- You may not post attachments
- You may not edit your posts
-
Forum Rules
|
|


 Reply With Quote
Bookmarks