-
23-05-2011, 02:58 PM
#131
Member


-
23-05-2011, 03:14 PM
#132
Member


 Originally Posted by buns

So is this good or bad?
All I'm saying is that, in my view, right now SKL's fundamentals appear to be 'about right'; that the market's value of SKL is close to my fair value range for SKL; that it's neither severely under or over-valued. We'll have to wait for the FY11 result in mid-August for the next bit of scheduled information to determine if there's any potential valuation upside/downside.
I'd be interested to see what any chartist makes of SKL at the moment.
-
23-05-2011, 05:34 PM
#133
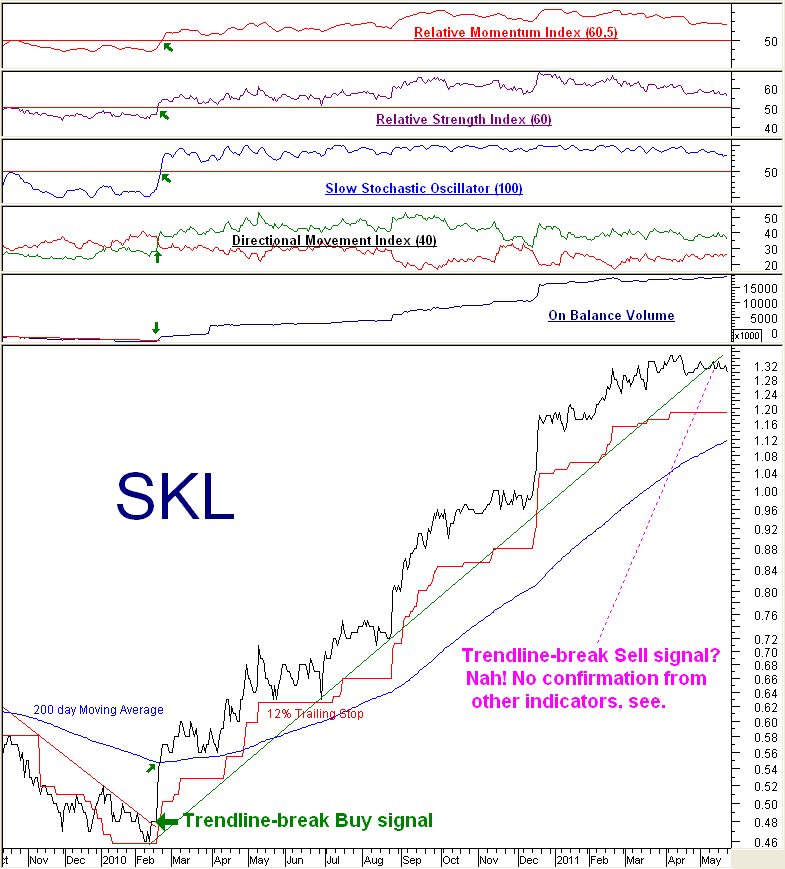
 SKL Chart SKL Chart
This chart updates the one posted here nearly a year ago (on page 5). It uses the same indicators and the same parameters, plus a few extra.
All of these indicators utilise reasonably long time periods and are thus suitable for long-term investors.
Recently, SKL broke below its confirmed long-term trendline. Technically, this constitutes a "sell" signal, but should longterm investors have acted on it? No. You can see that there was no confirmation from any of the other indicators. By way of contrast, compare this situation with the trendline-break Buy signal way back in February 2010 - no shortage of confirmation there! The OBV continues to climb steadily and none of the indicators featured here are anywhere near triggering sell signals.
You can see how the 200 day moving average is working well too - though, as usual, it was late getting you in and will obviously be quite late getting you out as well. I have added a Trailing stop (12%) for those of you that use such things, but again, this is likely to be one of the last indicators to get you out of SKL when this uptrend ends.
Some people think that the use of TA invariably leads to overtrading and therefore it is unsuitable for long-term investors, but you can see how well it has worked here, keeping you in SKL for well over a year so far, as the uptrend trundled on. It will get you out too - when the uptrend weakens or ends.

-
23-05-2011, 05:42 PM
#134

My crayon system in full agreement. Lots more blue bars of late , indicating sideways movement , but no red bars
Attachment 3384
Last edited by ratkin; 23-05-2011 at 05:44 PM.
-
23-05-2011, 06:35 PM
#135

thanks for the updates phaedrus and ratkin.
-
17-06-2011, 02:54 PM
#136
Member


Recent share price drop to $1.17....is this general market weakness or has the recent Christchurch tremors caused some extra damage or are SKL's markets experiencing softening demand???
Another overhang to think about is if Salvus winds up, as proposed, it will be unloading nearly 2m SKL shares.
-
17-06-2011, 03:35 PM
#137

 Originally Posted by Catalyst

Recent share price drop to $1.17....is this general market weakness or has the recent Christchurch tremors caused some extra damage or are SKL's markets experiencing softening demand???
Another overhang to think about is if Salvus winds up, as proposed, it will be unloading nearly 2m SKL shares.
Have just rung Carroll at SKL.All well ,working hard,no damage,she is getting fit getting under her desk,then up again,then under again.Good sense of humour.She did not know the SP had weakened.No reason she knew.Maybe people think there is damage and interruptions.
-
17-06-2011, 05:41 PM
#138
Member


So is the TA showing a sell given the large price drop in the last two days? Almost 10% 125 down to 115. It appears that the trailing stop loss Phaedrus was using would have been hit unless I've misread the chart. Any updates guys?
-
17-06-2011, 05:47 PM
#139
Member


You've eliminated one possible factor, percy. Others might be the non-appointment of a permanent CEO, the recent fiasco with the shortage of independent directors, and the absence of a once-confidently-expected further positive earnings update. Minor qualms apart, I upped my holding at the death today @ 114.
-
17-06-2011, 07:35 PM
#140
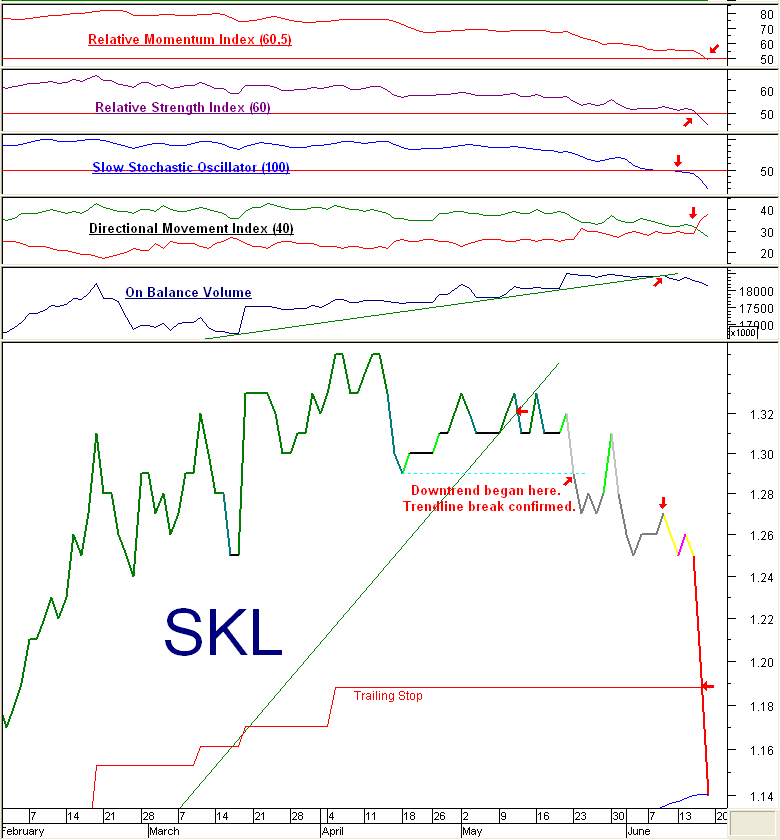
 SKL Chart Update. SKL Chart Update.
Here is an updated and enlarged chart for you, Arcticblue, using the same indicators and periods as before. Red arrows mark sell signals. You can see that the trendline-break "sell" signal was confirmed a few days later when the SKL uptrend became a downtrend. Next to trigger were the OBV with a trendline break and an MSI warning (yellow). These were followed followed by sell signals from the slower oscillators. The trailing stop triggered last and todays Close is right on the longterm 200 day moving average (blue line).
I doubt that many people would have waited for the trailing stop to be hit before selling.

Tags for this Thread
 Posting Permissions
- You may not post new threads
- You may not post replies
- You may not post attachments
- You may not edit your posts
-
Forum Rules
|
|

Bookmarks