-
Member


Wow, didn't really expect that upgrade. Fundamentals still look attractive, in my view.
FY10 NPAT normalised = $12.9m ($10.5 midpoint + $2.4m abnormal costs)
EPS = $12.9m / 191.4m shares = 6.7c
PE = 68c / 6.7c = 10x
FY11 NPAT should also be a step up to around $15m - $16m.
Plus the company's debt position is likely to be further reduced.
Disc. Holding
-

I agree, Catalyst. I thought $10 - $11m might have been "before abnormals" and had to re-read the announcement a couple of times... Before abnormals was $4.3m in first half, so second half looks to be around $8m which bodes well for your FY2011 forecast.
From what I've seen, analysts are behind the ball on this one, so could well see a small run to around 76cps if the market lets up in a day or two.
-

Bit of a volume clean out in the last few sessions, so now, with the more positive market tone, looks to be making that next move. Running about a year behind RBD in the "coming out of rehab" stakes and may well provide similar returns to those seen with RBD in the past year. Odd that both listed around the same time... maybe it takes a decade for a company to deal with all the legacy issues the smart-ones float them with.
Or perhaps it's just the feature of a bearish market - as Paper Tiger once wisely pointed out, "A falling tide drops all boats, except for the ones where they finally fix the holes up and pump out, and the ones that hit the bottom which obviously don't sink further though they may get stuck in the mud...."
Anyway, would be nice to see a close at 72cps or higher, to confirm the break from this range (and make those active traders sorry they got out on the trend break at about 65cps!  ) )
-
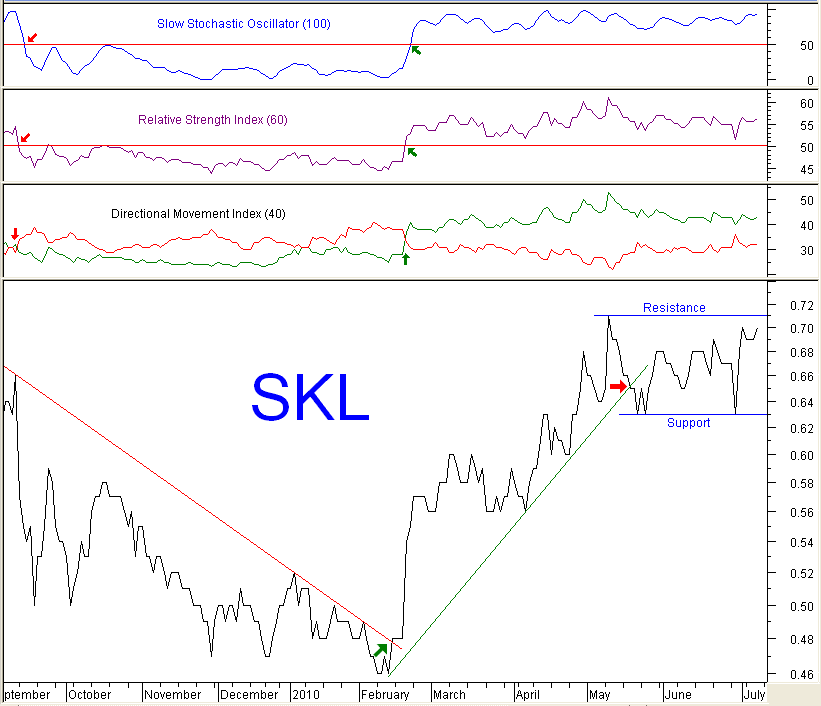
 SKL Chart SKL Chart
 Originally Posted by Lizard

..... and make those active traders sorry they got out on the trend break at about 65cps!
I'm afraid that such lowlife are incapable of finer human emotions, Liz. They are more likely to judge their efforts by such base concepts as pure monetary gain - and having made 35% in 3 months, I doubt that they are feeling anything other than smug. Intellectually, such types are capable of grasping only the simplest concepts. Their basic "philosophy" (if indeed it could be called such) is based on crude ideas such as "Buy low, sell high" and "a bird in the hand is worth two in the bush". Don't you think that we should feel sorry for them, Liz?
Of course not all traders are tarred by the same brush. Less rapacious, more patient investors are often quite happy to hold stocks that are crabbing sideways - at least for a while. They might well be using slower indicators such as the 3 shown here.

The chart shows the latest trade at 70 cents - the Close may be different.
-
-
 Misplaced gratitude? Misplaced gratitude?
 Originally Posted by Lizard

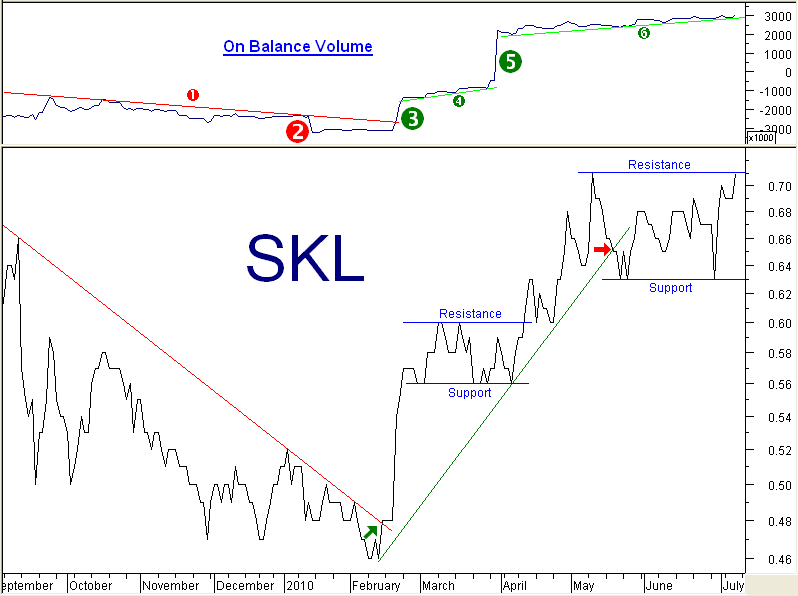
Am very grateful you didn't confuse this chart by throwing in the dubious-looking OBV step.
Huh? Far from confusing the chart, the OBV adds further clarity - and I certainly cannot see any "dubious-looking" OBV step! Reading through the OBV signals :-
(1) Downtrending OBV. Bearish. (Price kept falling)
(2) OBV "step" down. Bearish. (Price continued to fall).
(3) OBV "step" up. Bullish. (Price continued to rise).
(4) SKL in a trading range, but OBV in an uptrend. Bullish. (Upside breakout of trading range expected).
(5) OBV "step" up. Bullish. Confirms expectation of an Upside breakout. (Tick!) Price continues to rise.
(6) SKL in another trading range but OBV in an uptrend. Bullish. Upside breakout of trading range expected.

This is TA working to perfection, Liz (assuming there will be an upside breakout from the current trading range!). You can even see the same "proven" pattern repeating itself.
Which "step" did you feel was "dubious-looking" - and why?
-
 and in the blue corner, Paper Tiger and in the blue corner, Paper Tiger
 Originally Posted by Phaedrus

Huh? Far from confusing the chart, the OBV adds further clarity - and I certainly cannot see any "dubious-looking" OBV step! Reading through the OBV signals :-

For someone who puts great store on these dubious "OBV step thinggies" you ought to check your data source more carefully. (Hint look right)
regards
Paper Tiger
-

Hi Phaedrus.
My dubious step shows on my freebie charts on 2 July when the price fell 1cps on 3.78m shares traded. However, perhaps your data excludes the 3.5m crossed before open at 67cps that day?
Happy to stick with your version. 
-

Hi Lizard (trading partner)
Please BUY 2m SKL at market today.
Please exit the position the sooner of - 2 years, 100% profit, a deterioration in the business that leads to a fall in the valuation below our previously discussed margin of safety.
Thanks pal.
Last edited by h2so4; 09-07-2010 at 09:28 AM.
h2
-

 Originally Posted by h2so4

Hi Lizard (trading partner)
Please BUY 2m SKL at market today.
Please exit the position the sooner of - 2 years, 100% profit, a deterioration in the business that leads to a fall in the valuation below our previously discussed margin of safety.
Thanks pal.
Huh?? 
Happy to watch how you buy 2m at market... (when I get that big, I will move onto stocks with bigger caps and more liquidity).
Interested in hearing more about our previously discussed margin of safety - was there a post somewhere?
Tags for this Thread
 Posting Permissions
- You may not post new threads
- You may not post replies
- You may not post attachments
- You may not edit your posts
-
Forum Rules
|
|


 Reply With Quote
 )
)


Bookmarks