-
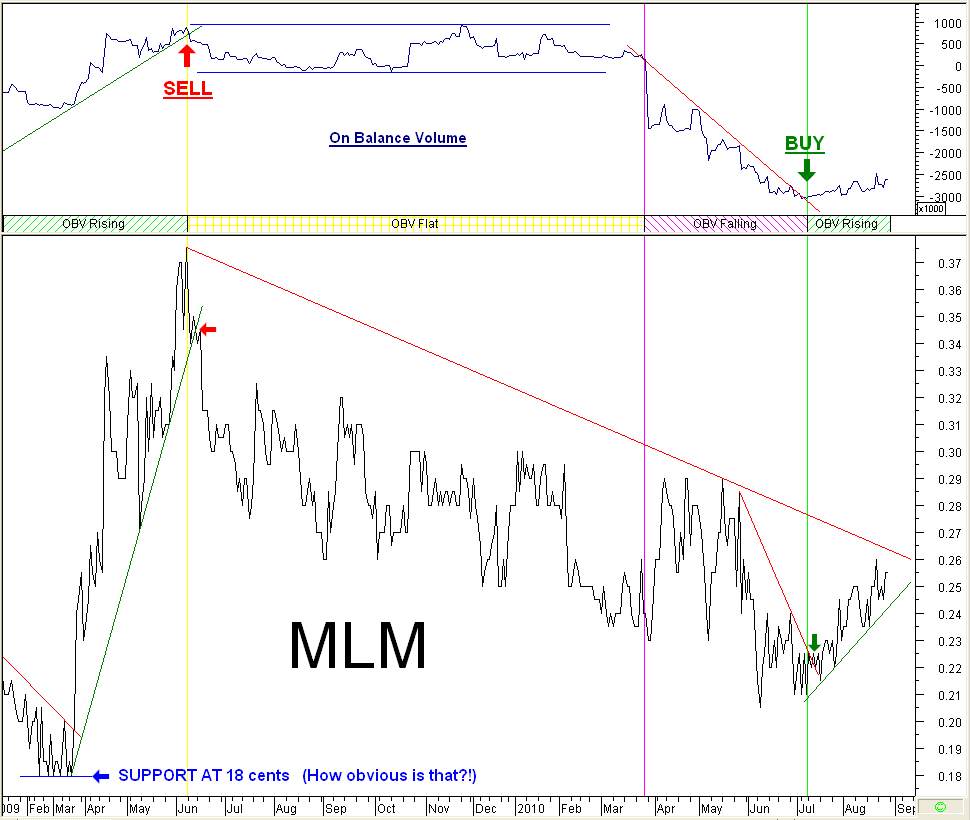
 MLM Chart featuring Kindergarten level TA. MLM Chart featuring Kindergarten level TA.
The MetaStock TA software that I use provides well over a hundred technical indicators. On top of that I have created many indicators of my own - but who needs 'em? Here we have a chart utilising nothing more than the Closing price and a simple Volume indicator. Judge for yourself how effective these have been in providing MLM trading signals.
Over the 20 month period covered by this chart, the OBV volume indicator has triggered just one sell signal and just one buy signal. Volume changes are supposed to precede price changes, so the OBV should be a leading indicator, providing signals ahead of those derived from price action. That is exactly what happened here with each OBV signal being followed within a few days by price action breaking through an established confirmed trendline. The Red arrow marks the trendline-break Sell signal and the green arrow marks the trendline break Buy signal.
Following the Buy signals, MLM went into a "medium-term" (3 month) uptrend. There is a confirmed trendline in place.

In an attempt to temper Shasta's enthusiasm for this stock, it is important to realise that MLM is still in a "longterm" (15 month) downtrend and that the "longterm" trendline is still unbroken.
 Posting Permissions
- You may not post new threads
- You may not post replies
- You may not post attachments
- You may not edit your posts
-
Forum Rules
|
|


 Reply With Quote
Bookmarks