-
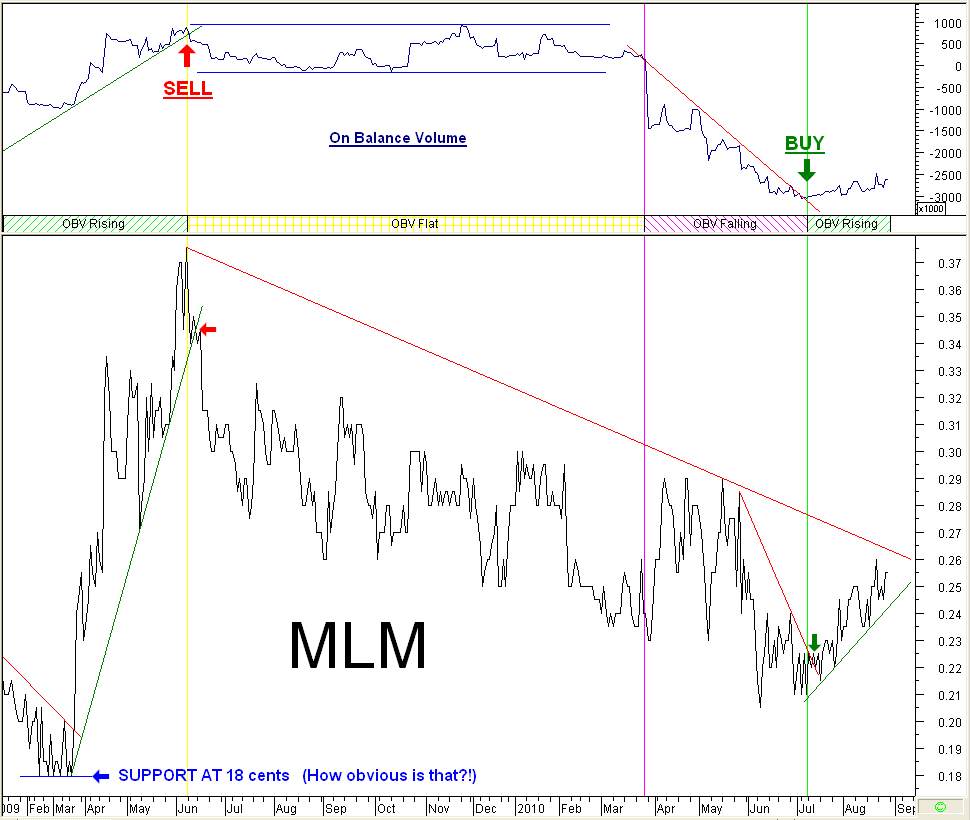
 MLM Chart featuring Kindergarten level TA. MLM Chart featuring Kindergarten level TA.
The MetaStock TA software that I use provides well over a hundred technical indicators. On top of that I have created many indicators of my own - but who needs 'em? Here we have a chart utilising nothing more than the Closing price and a simple Volume indicator. Judge for yourself how effective these have been in providing MLM trading signals.
Over the 20 month period covered by this chart, the OBV volume indicator has triggered just one sell signal and just one buy signal. Volume changes are supposed to precede price changes, so the OBV should be a leading indicator, providing signals ahead of those derived from price action. That is exactly what happened here with each OBV signal being followed within a few days by price action breaking through an established confirmed trendline. The Red arrow marks the trendline-break Sell signal and the green arrow marks the trendline break Buy signal.
Following the Buy signals, MLM went into a "medium-term" (3 month) uptrend. There is a confirmed trendline in place.

In an attempt to temper Shasta's enthusiasm for this stock, it is important to realise that MLM is still in a "longterm" (15 month) downtrend and that the "longterm" trendline is still unbroken.
-
Member


Well, I liked the look of the above graph, so bought into MLM at 25.5 on 29th...and the uptred continues as it rolls through 29...and by my careful TA calculations...the long term downtrend is broken...
So the question is: Will OBV signal be enough to tell me when to get out? Or perhaps...will it be the first to tell me to get out?
-

 Originally Posted by PhaedrusFollower

Well, I liked the look of the above graph, so bought into MLM at 25.5 on 29th...and the uptred continues as it rolls through 29...and by my careful TA calculations...the long term downtrend is broken...
So the question is: Will OBV signal be enough to tell me when to get out? Or perhaps...will it be the first to tell me to get out?
MLM - 76% owned PMQ - sale of Wolfram Camp Tungsten Project (85% interest)
http://www.stocknessmonster.com/news...E=ASX&N=223640
The total sale price of $8m is more than PMQ's current market cap, but it was there key project.
MLM should really acquire the balance of PMQ they don't hold & use the cash to develop there other projects
-
Member


Thanks Very Much for that Shasta...I was wondering why there was such interest today....will that 30c resistance get broken or not...it's been tested all day and a few times in the last 6 months...
-

 Originally Posted by PhaedrusFollower

Thanks Very Much for that Shasta...I was wondering why there was such interest today....will that 30c resistance get broken or not...it's been tested all day and a few times in the last 6 months...
I'll update the MLM spreadsheet each day now it's starting to turn around chart wise
MLM share price $0.30
NTA (Listed Investments + Est Cash) = $0.40
Value attributed to MLM's own projects = $0
Discount to NTA = 26%
-

 Originally Posted by shasta

I'll update the MLM spreadsheet each day now it's starting to turn around chart wise
MLM share price $0.30
NTA (Listed Investments + Est Cash) = $0.40
Value attributed to MLM's own projects = $0
Discount to NTA = 26%
MLM - 34% owned ORM project acquistion
http://www.asx.com.au/asxpdf/2010090...2m9365l2jj.pdf
HREE, Gold & Uranium (close to NTU's HREE project)
ORM share price up +6.5c today to 15c (+76.47%)
-

 Originally Posted by shasta

MLM - 56% owned MTE - China Coal receives final approval (for $30m investment)
http://www.stocknessmonster.com/news...E=ASX&N=223847
pS. Check the Surat Basin map, this is right among the CSG highway!
-

 Originally Posted by shasta

MLM Update:
MLM share price $0.28 (Market Cap ~$35m @ $0.28)
NTA = $0.42 (Listed Investments ~$46.8m + Est cash ~$5.5m = $52.3m)
Discount to NTA = 33%
-

 Originally Posted by shasta

MLM Update:
MLM share price $0.28 (Market Cap ~$35m @ $0.28)
NTA = $0.42 (Listed Investments ~$46.8m + Est cash ~$5.5m = $52.3m)
Discount to NTA = 33%
MLM - 56% owned MTE
http://www.stocknessmonster.com/news...E=ASX&N=223920
Bank of America have increased there stake to 11.1%
-

 Originally Posted by shasta

MLM - Nornico Scoping Study Summary
http://www.stocknessmonster.com/news...E=ASX&N=224037
MLM's 100% owned flagship project (which the market is attributing NO VALUE to it)
Production anticipated for 2013, with a 10 year LoM, for 2,700T Ni, 160T Co, 7,500kg Sc (Sc = Scandium) = Annual Revenue/Operating cashflow ~ $A45m
Ni cash costs of <$US3/lb when including cobalt & scandium credits
MLM - Media Release
http://www.stocknessmonster.com/news...E=ASX&N=224040
MLM - Presentation Excellence Mining & Exploration
http://www.stocknessmonster.com/news...E=ASX&N=224042
A great read on why MLM is so undervalued!
Last edited by shasta; 20-09-2010 at 02:34 PM.
 Posting Permissions
- You may not post new threads
- You may not post replies
- You may not post attachments
- You may not edit your posts
-
Forum Rules
|
|


 Reply With Quote


Bookmarks