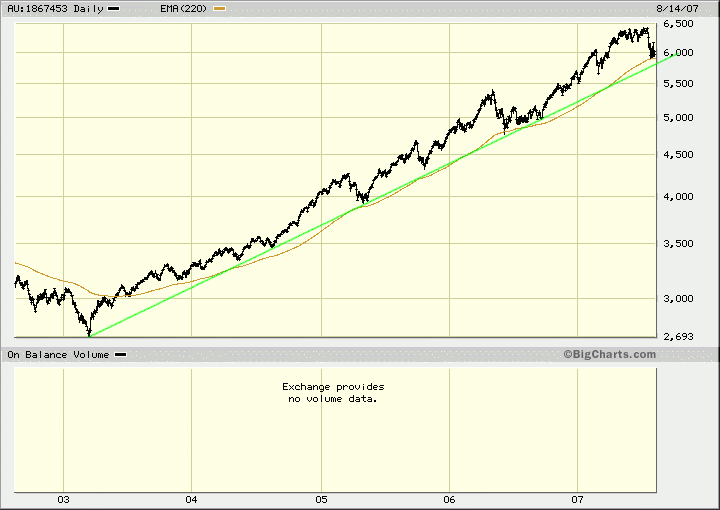
-
Member


IMHO Phaedrus and Ratkin both make good points.Phaedrus doesn't there need to be an overlay of common sense in chartist decisions?I see in USA JB were funds using computing buy/sell programes have just lost 30% of their value.
Disclaimer:I was around in 87 and lost 70% value in my equity portfolio in the likes of Equiticorp and IEP .BUT then made it all back in 2 years by buying' low risk' stocks
-

Out of interest, are you taking the 2 years recovery from October 1987 or from the low point in your portfolio? The former would seem extremely challenging from the data I have.
According to my data (using the NZ Herald Index) the NZ market had gone sideways for the 9 months prior to the crash, only just reaching the earlier Dec '86 high a few weeks prior. It then lost 60% of value in around 5 months, went sideways for about 18 months and had staged a brief rally to be 50% off its lows at the end of the 2 year period. The number of listed companies had shrunk by 20% over that period.
This brief rally was then quickly followed by another slump which appears to have taken another 50% off the index until the low in around Dec 1990 - around 70% lower than 4 years earlier in Dec 1986. By then, my data shows 142 listed companies - around half the number of October 1987.
Equiticorp failure didn't occur until January 1989 (although it was certainly easy to lose alot on it prior to that).
To recover from a 70% loss in 2 years would have taken gains of 82% pa. I'm not claiming you didn't achieve that - just that you seem to be making it sound far less fearsome than it was! I would think many investors would never have recovered from it at all without investing new funds back in the market.
-
Member


LizardIt was from the low point of my portfolio.I was overseas during October till Jan 88.Because banks had share cert's as security over over my OD they wouldn't release certificates to sell shares till the OD was paid!!!I was unable to sort out the tangled web untill I got back in Jan.
My point is by buying in to Q stocks that had been oversold in the crash some serious money can be made.
BUT:I don't believe this market has been seriously oversold YET.Time will tell
My point about computer programmes.Overseas mega funds eg JB Were have lost lots of serious money over short time in the last couple of weeks.Their buy/sell decisions are all based on computer models that are based on the assumption markets are predictable ?
-
Junior Member


so if i understand this correctly, if the black line goes through all 5 of the coloured lines, then you know the **** is hitting the fan?
-
Member


Living2
Agreed with most points except present situation - it is early days and not 'oversold' yet.
Phaedrus and Ratkin are actually talking about different phases; P at the beginning and R during and end of the phases.
'87 was damn near wiped out. I remembered Sir R on TV saying....this is awful! Took me a lot longer than 2 years to recover.
The modern market is contorted, complicated, confused and may be even
corrupted by so many factors, systems and products. What is happening is no more than a cleansing process - the quality fundamentals will prevail at the end and that is what will turn the market eventually.
cheers
Last edited by foodee; 14-08-2007 at 09:22 AM.
Reason: grammer1
-
Junior Member


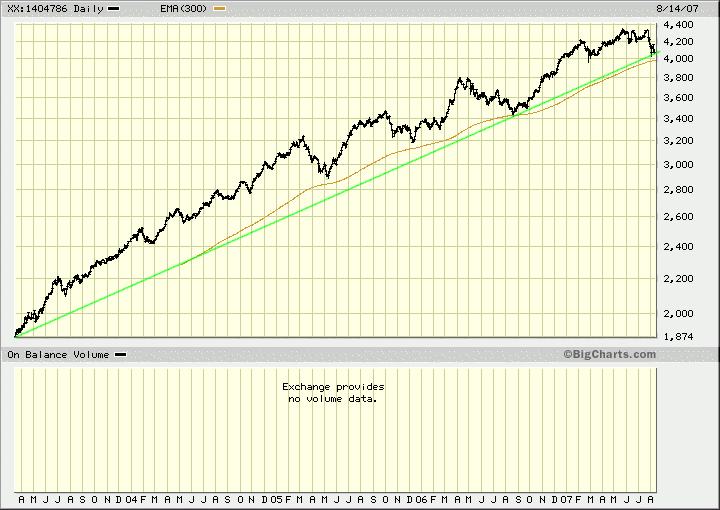
Phaedrus ... can you tell me if the Long-Term Exponential MA line from the chart posted on the 10th is still sitting around the 4000 mark for the NZSX50 Index ??. I'm trying to understand & educate myself about TA charting methods & like yourself would be extremely concerned if the index breached this long-term MA level. Thanks in advance.
-
Member


-
 Intraday Chart Update Intraday Chart Update
Monty, right now the Index is at 4007, with the longterm ma at 3978.

-
Junior Member


Thanx Limegreen/Phaedrus .... enjoy reading your posts !!.
-

Thanks Limegreen. Though from what I can figure from the freebie charts, the ASX200 slow stoch and RSI would have triggered a "caution" recently using the same period as above for NZX. Interestingly though, the Dow itself may still be sitting on the fence on those indicators.
Tags for this Thread
 Posting Permissions
- You may not post new threads
- You may not post replies
- You may not post attachments
- You may not edit your posts
-
Forum Rules
|
|


 Reply With Quote


Bookmarks