-

When collated in the same way, would NZX appear to be in a secular bull market?
-
Thanks Hoop, very interesting.
-
Hoop - a close well below 12000 for the DOW probably doesn't surprise you ...... but not a good sign is it
-
 Originally Posted by Hoop

Below are the present index levels and their resistance levels (RL).
Index....... Present ..........Major R L .........Next Impt RL
Dow ...........12635 ...............12800 ..............13000
S&P500.... ...1381................ .1400 ................1450
FTSE100... ...6026.................6000 breached....6100
Hang Seng...25035............ ...26000
Nikkei .........13860 ...............13600 breached..14700
ASX.............5922............... .6000..................6400
NZX ............3711............... .3900
For an investor (with Bear market strategy) to buy into this rally at this late level there is little to gain and much to lose. The Bear market assumption is that the indices have a high chance of respecting their major resistance levels ..so stay out.
Hi Winner
yes no surprise that the major markets around the world are breaking through their support levels, it was predicted to happen but the timing is hard to figure (see #96 .. 20th Feb)
As most have broken though the support levels (SL) this suggests a high chance that another downturn is in progress. Just how big the fall is guess work at the moment but TA does give some indication, it may be about 8% fall for the USA and Japan and 13% for Australia (see figures below)
I included the above quote box to show just how much has changed since the 5th of February. A month ago the indices were bullish and were testing to breach their resistance levels ...but now those old resistance levels seem along way a way with new resistance levels [RL] (old broken support levels[SL] ) forming below them when support levels are broken.
Index..... 5th Feb ..7th Mar...RL......... SL...........Next target SL
Dow ...........12635 ..11894....12000.......................11200 -7%
S&P500.... ...1381......1293.....1300........................1200 -8%
FTSE100... ...6026.....5700.....6000.....5500 (has not broken support)
Hang Seng...25035....22501...26000....22000 (has not broken support)
Nikkei .........13860 ...12783...13000.......................12000 -8%
ASX.............5922......5369.....5600........................4800 -13.5%
NZX ............3711..... 3559.....3940.....3540* (has not broken support)
* new target SL of 3540 set at beginning of Jan2008 when NZX broke the primary SL of 3940
Above figures are rounded for simplicity.
The NZX drop of 11 points today still has it above its support level(SL) but only just. If this support level of 3540 is broken, the new target SL is 3540 - (3940 - 3540) = 3140 (12.5% decline) With the countries all around us especially Australia breaking support, it looks grim that the NZX will probably follow suit.
Although these SL targets are theoretical at best it looks as if NZ and Australia are going to be worse off (% fall) this time around than USA/Asia. (NOTE:- this is only relevant if the indices test those targeted SL in the future of course, they may or may not, but there is a good chance they may considering this is a bear market). There is a good chance a rally (up to the RL) may appear before the targeted SL are tested
Last edited by Hoop; 10-03-2008 at 11:29 PM.
Reason: Liz still working on the figures but yes from a quick glance NZX seems to be in a secular bull phase maybe Winner can confirm
-
 what bear market? what bear market?
my most trusted analyst, Dr Copper, has declared the bear market finished. There was/is no bear market and no recession - in fact dr Copper is predicting strong economic growth over the next 12 months at least
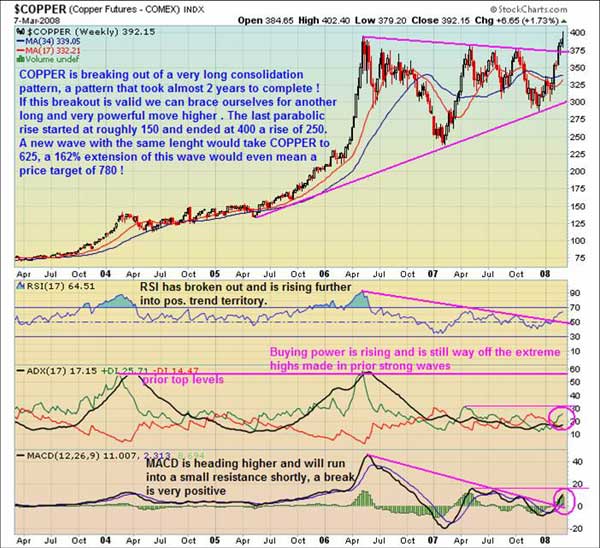
He who lives by the crystal ball soon learns to eat ground glass. (Edgar Fiedler)
-
Nice info Mick
It seems that commodity investment is still one of the places to have your money at the moment.
Mick..congratulations on your astute investing in tough times, it seems you are doing exceptionally well. Keep it up...it's great to hear success stories and people willing to share that with others. I hope other investors have picked up your strategy early and are in enjoying this commodities boom.
To me this is more evidence to confirm that stocks and the sharemarkets are in a bear market phase, as stocks v commodities are countercyclic in nature.
Winner briefly pointed this out in post #95.
A larger explanation is below
Quote article from Market Oracle
How To Invest During Economic Downturns: Commodities versus Stocks
Commodities / Learning to Invest Jan 28, 2008 - 02:54 PM
By: Mary_Rivas

In an article published yesterday (January 23, 2008) in the Financial Times , George Soros stated that a recession in the U.S. is now more or less inevitable. He noted that China , India and some of the oil-producing countries however are in a very strong countertrend. Soros went on to explain that the current financial crisis is less likely to cause a global recession than a radical realignment of the global economy, with a relative decline of the U.S. and the rise of China and other countries in the developing world.
A growing number of economists, money managers and analysts have begun issuing warnings that a recession may be hard to avoid in 2008. On top of that, recent data is indicating an increase in inflation that is being fueled by higher prices for commodities such as oil, wheat and corn.
Given the growing concerns of the future of the economy, I thought it would be very helpful to provide readers with some history on how commodities and stocks have performed over various economic cycles.
Performance of Commodities vs. Stocks
To understand how commodities and stocks perform during economic downturns, let's look at past trends.
In a revolutionary study from the Yale School of Management's Center for International Finance entitled Facts and Fantasies About Commodity Futures, research revealed very important differences in how commodities and stocks perform over time. The research team analyzed how commodity investments performed compared to stocks and bonds over the last half century .
Below are some key highlights of the research findings over various investment horizons:
Stocks and bonds are negatively correlated with inflation . In other words, as inflation increases, stocks and bonds tend to move in the opposite direction. Commodities futures, in contrast, are positively correlated with inflation. When inflation rises, commodity futures tend to rise as well.
Commodity prices can rise even during economic downturns. Commodities can serve as a hedge against stock market and economic risk.
Commodities and stocks have a negative correlation . In other words, commodities and stock perform tend to perform oppositely over time. When stocks go down, commodities, over time, tend to move up and vice versa. Thus, a portfolio invested in stocks and commodities, is likely to experience less volatility than a portfolio that is comprised of only stocks.
From 1959 to 2004, commodities futures produced comparable annual returns to stocks and greatly outperformed bonds.
Commodities have had less risk than stocks over time. The volatility (i.e., fluctuations in portfolio returns) of the returns of commodities futures over a 43-year period was less than the volatility of the S&P 500 index over the same period.
While no one can be certain if the looming recession will be global or more or less confined to the developed world, one thing is clear: ignoring commodities in a declining stock market is irrational.
Every investor can benefit by learning how to diversify beyond stocks and bonds. A properly diversified portfolio that includes commodities can enhance return and reduce risk. To learn more, visit www.powerpathtomoney.com .
In a recent interview with Bloomberg ( January 7, 2008 ), Jim Rogers , known by many as the world's expert on commodities investing, reaffirmed his positive outlook on commodities. He stated that ``All commodities are going to be in much shorter supply for another decade.'' Rogers indicated that in the event of a global recession, agricultural commodities may be the best investment among commodities.
The findings of the Yale study and others have triggered huge changes in the financial industry---many which affect you. Investment companies are increasingly creating new investment vehicles to enable individual investors to participate in commodity investing. Today there are easily accessible ways for you to invest in commodities and to find which investment vehicle is right for you. Anyone can now invest in commodities in low-cost and easy ways that were not available during the last commodity bull market.
By Mary Rivas
Mary Rivas has over 16 years of experience working in the investment management industry, and is the author of Power Path To Money, which is available at www.powerpathtomoney.com . She wrote this book to teach people 1) how to use low cost ways to easily invest in commodities and 2) how to invest in themselves to achieve maximum success. Her book reflects her philosophy that successful investing is achieved by being knowledgeable about investment opportunities and by developing one's inner power.
-
Originally Posted by Hoop
Hi Winner
yes no surprise that the major markets around the world are breaking through their support levels, it was predicted to happen but the timing is hard to figure (see #96 .. 20th Feb)
As most have broken though the support levels (SL) this suggests a high chance that another downturn is in progress. Just how big the fall is guess work at the moment but TA does give some indication, it may be about 8% fall for the USA and Japan and 13% for Australia (see figures below)
I included the above quote box to show just how much has changed since the 5th of February. A month ago the indices were bullish and were testing to breach their resistance levels ...but now those old resistance levels seem along way a way with new resistance levels [RL] (old broken support levels[SL] ) forming below them when support levels are broken.
Index..... 5th Feb ..7th Mar...RL......... SL...........Next target SL
Dow ...........12635 ..11894....12000.......................11200 -7%
S&P500.... ...1381......1293.....1300........................1200 -8%
FTSE100... ...6026.....5700.....6000.....5500 (has not broken support)
Hang Seng...25035....22501...26000....22000 (has not broken support)
Nikkei .........13860 ...12783...13000.......................12000 -8%
ASX.............5922......5369.....5600........................4800 -13.5%
NZX ............3711..... 3559.....3940.....3540* (has not broken support)
* new target SL of 3540 set at beginning of Jan2008 when NZX broke the primary SL of 3940
Above figures are rounded for simplicity.
The NZX drop of 11 points today still has it above its support level(SL) but only just. If this support level of 3540 is broken, the new target SL is 3540 - (3940 - 3540) = 3140 (12.5% decline) With the countries all around us especially Australia breaking support, it looks grim that the NZX will probably follow suit.
Although these SL targets are theoretical at best it looks as if NZ and Australia are going to be worse off (% fall) this time around than USA/Asia. (NOTE:- this is only relevant if the indices test those targeted SL in the future of course, they may or may not, but there is a good chance they may considering this is a bear market). There is a good chance a rally (up to the RL) may appear before the targeted SL are tested
Update:
Looking at TA the markets are down trending
Ftse has broken 5500 support, also Hang Seng and the NZX...now all the above markets have broken their supports.
Deduction: All above markets are coupled, and no sign of decoupling is evident.
The Dow S&P Hang Seng attempted to break back above their old support (which is now a resistance) and so far have failed, thus reinforcing the resistence level
Note that the Nikkei has fallen through it's target support level (12000) without any hesitancy and has not recovered back above it with today's rise, if the markets are coupled (which they seem to be) this could be a very bad signal of an extended downturn (severe) emerging. This signal however may be false if the Nikkei target support level is regained and manages to stay above or around 12000 for a period of time.
It is amazing really (if true) that the first signals show up in Japan and not Wall St.
Warning!
-
The key indices supports, threatened to break 2 weeks ago in most exchanges held, Nikkei had a false break.
Some commentators say the worst is over....is it?
Strange talk especially when money is still evaporating even as we speak. The FED is feeding a financial black hole with borrowed money, and cracks are appearing within the FED's own departments as whether this was a smart or a dumb idea. So Benji (Bernanke) could a hero or a zero, only time will tell.
For us investors, the question appears.."Is this a bull recovery from a short lived bear ...or a rally within the bear market?
DOW 12800.. NZX50 3900.. S&P500 1400.. FTSE100 6000.. HangSeng 26000.. ASX 6000.. Nikkei225 15000..
All of the above indices figures are primary resistance levels, if these levels are breached the bear is dying (but not necessarily dead!!!). Could be a genuine recovery or it could be a setting of a higher resistance level and a classic but destructive bull trap.
Respect of these indices resistance levels indicate that we were experiencing a typical bear market rally.
----------------------------------------------------------------------------------------------------------------------------------------------
Bear market rallies only delay day of reckoning
By Ambrose Evans-Pritchard, International Business Editor
Last Updated: 12:13am BST 02/04/2008
Every slump is punctuated by exuberant bursts of optimism, known to traders as "bear market rallies". Japan had four false dawns during its long slide into the abyss. Each lifted Tokyo's Nikkei index by an average of 53pc. Such bounces can be intoxicating.
The financial crisis in full
Read more of Ambrose Evans-Pritchard Teun Draaisma, Morgan Stanley's stock guru, expects the current rally to boost Europe's MSCI 600 index by 21pc from its trough in late January, with similar moves on the S&P 500. The battered shares do best: builders and banks this time.
There have been nine bear rallies since 1970. The average length is four months. The surge misleads investors into believing that sunlit uplands lie ahead. Then the sucker punch hits.
"The Federal Reserve's actions have averted financial Armageddon, but they cannot avert an earnings recession. We don't expect a new bull market until early 2009," he said.
Morgan Stanley says earnings will fall 16pc this year as debt leverage kicks into reverse.
Investor psychology is "asymmetric". The market discounts trouble in advance. Share prices start falling a year before earnings peak. In a downturn investors keep selling until earnings hit bottom.
"Bear markets are terrible for the human psyche. You get one profit warning after another. People see their hopes dashed so many times that they stop believing," said Mr Draaisma.
"You have got to be very disciplined and not buy shares too early just because they look cheap. Things can go down further than you ever dare believe," he said. He is not predicting a bloodbath along the lines of 1929-1933 (-88pc) or 2001-2003 (-49pc): just a long slog, with failed rallies.
For now, the markets are flashing a tactical buy signal. Mr Draaisma's "capitulation indicator" has crashed to the lowest level since the 1998 LTCM crisis: the share "valuation indicator" is near an all-time low.
UBS is also gearing for a big rebound, convinced that the Fed's move to shoulder $30bn of Bear Stearns liabilities has changed the game.
In its latest report -"Ready for a Rally" - it said financial shares rose 448pc in the 12 months after the Swedish rescue in 1992, 88pc after Japan's Revitalisation Law in 1998; and 82pc after Roosevelt's Emergency Banking Act in 1933.
The pessimists at Société Générale remain sceptical, even though the Fed has gone nuclear. "We expect global equity prices to fall by up to 75pc from their peaks as a deep global economic downturn unfolds over the next few years," said Albert Edwards, their global strategist. He fears a 50pc collapse in earnings, compounded by an "Ice Age derating of equities".
It may echo the Lost Decade in Japan, where stocks fell 80pc. The yields on state bonds kept falling as debt deflation engulfed the banks, thwarting efforts to nurse lenders back to health by the usual device: "steepening yield curve". The authorities were left chasing their own tails. Having lived through this, Japan's chief regulator Yoshimi Watanabe has advised Washington to go for a quick taxpayer rescue, rather than trying "to fix the hole in the bathtub".
Whatever happens, there will always be tactical rallies. Mr Edwards cites four Wall Street bounces above 25pc in the 2001-2003 bust. The buying cue is when investor gloom nears black despair. The put/call ratio on options is now at a bearish extreme of 0.90.
"That would historically suggest that a joyous 25pc spring rally is close at hand," he said. Yet Mr Edwards remains wary as long as analysts cling to their belief that earnings will rise 11pc in 2008. This is not the sort of "washout" level of gloom required to clear the air.
Still, the oldest adage on Wall Street is "never fight the Fed". In short order, Ben Bernanke has slashed interest rates by 300 basis points to 2.25pc, and invoked the emergency clauses of Article 13 (3) of the Federal Reserve Act for the first time since the Great Depression to take on direct credit risk.
The Bush administration has told the housing agencies Fannie Mae and Freddie Mac to absorb $200bn of extra mortgage debt. It has implicitly nationalised them in the process. The network of Federal Home Loan Banks has mopped up $900bn of mortgage securities. Congress has rushed through a $170bn fiscal blitz.
This is not to be sniffed at. It is worth a good spring rally, until the inexorable logic of a 25pc house price crash prevails once again.
Bernard Connolly at Banque AIG, who foresaw this crisis with uncanny accuracy, believes central banks will resort to full-throttle reflation, setting off a fresh boom in shares and gold. But this will occur only after the economic slump has spread to Europe and beyond.
The authorities will wait too long to act, believing their own decoupling myth. Unemployment will ratchet up. Civil unrest may rock Latin Europe.
In the end, the whole industrial world will stoke a fresh credit bubble to put off the day of reckoning, for another cycle.
The capitalist system is now so deformed by debt that it requires ever lower interest rates to keep going. It survives on perma-bubbles. Monetary rigour at this late stage would endanger democracy.
How did we ever let matters reach this pass?
----------------------------------------------------------------------------------------------------------------------------------------------
Hoop Disc: been buying stocks... Cash down from 90%-70% ..finger on the sell button ready to push on sign of sell signals.
Caution
Last edited by Hoop; 06-04-2008 at 11:04 PM.
-
Member


I've been sitting on the sidelines for sometime(with the exception of NZR).
I should have picked up Ebay when I posted here recently about it...my reluctance to do so would have seen a healthy profit.
I still think they'll do well in a downturn.......they are the world's biggest pawnshop...and the pawnshop owner wins when everyone else doesn't.
Other than that......I've seen the CANROYS(Canadian Royalty Trusts) come off their recent lows and are beginning to trend up. Selecting ones with strong yields and growing reserves could be a good way to hedge against the NZ dollar dropping off as predicted by some later this year, as well as hedging against ALL currencies depreciating.
I reckon if CANROYS deflate a bit with the global economy, they will not deflate as much, and will reinflate faster and higher...fairly safe in the long-term I reckon...especially if Soveriegn Wealth Funds have been gobbling them up to get out of their US Dollar hordes.
-
09-04-2008, 10:16 AM
#100
Secular bear markets are all about changes in valuation .... not about price changes even though the 2 are linked to some degree
We have yet to see any significant change in valuations of the S&P. The forward looking PE ratio is still quite high and is driven from a base of record high earnings and margins.
I still expect to see the E in the PE ratio (at least in the US but likely over the world to come under pressure) which will then have an impact on the P part.
One view of what I am trying to say
http://www.investorsinsight.com/blog...-the-bomb.aspx
With a conclusion - [/i]the implied earnings declines are paltry. So the idea that the equity markets are anticipating a recession unfortunately looks to be yet another example of the triumph of hope over reality. I guess I really haven't learnt to stop worrying and love the bomb just yet! [/i]
Still rocky times ahead so stock selection remains the key and keeping a close eye on those charts
 Posting Permissions
- You may not post new threads
- You may not post replies
- You may not post attachments
- You may not edit your posts
-
Forum Rules
|
|


 Reply With Quote

Bookmarks