-
06-12-2008, 01:38 PM
#141

Bottom pickers who guess it right are Heroes..until next time.
Asking a successful bottom picker how they did it and all you get is answers which appear with hindsight logical...e.g shares ridiculously cheap why were you not in?
Very seldom do you get a scientific answer based on analysis from previous endings of Bear market phases.
Below are some indicators some more reliable than others..but use them all together an investor can build confidence as to when to re-enter the market....When these indicators start lining up(all the ducks lining up in a row) then there is increasing probability that the bottom has been reached.
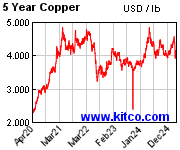
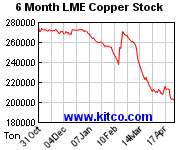
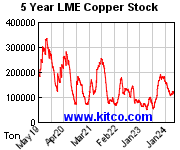
The most reliable of these indicators is Copper prices and DOW Theory ..analysis has shown that these indicators has so far never failed...other indicators have failed at least once.
I have written in red my view if this indicator has been triggered
1... Reversal trend (down to up) Spot Copper prices NO
2... Dow Theory in General May have
3... Equity price volatility at maximum around phase change (bull to bear /bear to bull) Yes
4... Commodity price / Equity inverse correlation disconnect signals start of Bear Market (3) final capitulation phase Yes
5... TA ....short uptrend off bottom Yes... but could be another (bear market rally) sucker rally
6... TA .... Most Globial Equity indices reaching clusters of long term support lines Yes
7... History Statistics: A crash in October bottoms in October Not true this time on some exchanges.
8... Commodity prices bottoms out at similar time to Equities. Not occurred yet
9... History: Equity markets bottom out halfway (58%) trough an economic recession If this indicator holds true this recession is going to be historically one of the longest recessions. Note NZ first to enter a technical recession is the first to end (Bollard announcement 4th Dec) ..indicator failed?
10... History: Govt and other system (Reserve Bank/Fed/rich individuals) intervene (nationalise) 2/3rds of the way down of the final C wave (capulation) before bottom Yes
11...A V shaped low volume rise off bottom ..followed by volatility and testing the bottom again...followed by lower volumes (Note DOW and S&P research) Also DOW Theory May have
12...US$ trend reversal aids Commodity/Equity recovery No
13...Falling index PE Ratio to below 10 and forward PE falling (not necessarly to below 10) Yes
14... FA showing well below valued recession proofed stocks with good income/profit /cash in bank flows Yes
15... Investors psychology Doom and Gloom with no hope (DOW Theory) yes to Doom and Gloom No to no hope ..although increase in no hope candiates (e.g can see only a flat index figure for future years)
16... Loss of appetite in all downward spiralling instruments e.g Short selling etc Mainly No..however many shortsellers been burn't lately so maybe yes in the near future
17...Fibonacci: 50% index retrenchment from previous Bull market high (historical average 40%) yes to most exchanges
18...Fibonacci Ratios wave C (capulation wave) equal to Wave A or 1.62 x Wave A or 2.62 x Wave A Yes
19... DOW Theory Bottom forming pyscology...a change of attitude from lets buy these very cheap shares to why buy at all Not yet
20...Credit interest very low tempts investors back to better returns property and Equities Not yet interest rates still falling.
21...Increase in secured Bonds activity Yes in NZ, don't know elsewhere
22... Freeing up of frozen monies, making money more available, usually through reserve bank (FED) intervention/Govt taxes etc Yes
23 Q-Ratio drops below 0.3 ..when a company value is less than 1/3 of it's start up value T/O activity helps equity recovery. Increased T/O activity. Yes to T/O activity (forced or otherwise). Q Ratio hard to assess Q-values to an index.
Conclusion
Probably many other indicators I have missed (Other posters may wish to add them) but as it stands there are 12 yes' 7 No's and 4 maybes.
The two most reliable indicators show a No and a maybe, which indicates the worst may not be over as of today.
As most of the ducks have not yet lined up you would have to be a betting man to call this the bottom...however a lot of triggered signs are out there..and this must point towards a favourable outcome. Maybe next week or next month more indicators may trigger.
Hoop personally thinks Copper is the Key indicator to watch.
Last edited by Hoop; 06-12-2008 at 01:51 PM.
-
09-12-2008, 09:01 AM
#142
Hoop
Of all the historical bottoms, none are formed over a 2 month period (thats not to say it cant happen this time). ie Oct-Nov 08
After big sell-off's when you look back at history on the monthly charts they all look like "V's"
But if yuo drill down, all bottoms are formed by a 4-9 month process of bouncing around the base. Sometimes with massive fake rallies.
IF this is to be a bottom then the outcome should be as follows
A bounce from here to say 1,000 on the SP.... then a retrace back down to say 750-800 1st Qtr 09...
Then a rally out 2nd Qtr 09.
I would be very surprised if this was it, and we just V our from here....
Q ratio is still at 0.65x on the SP
Copper has not bottomed
Auto Sales are still falling off a cliff
No positive signs anywhere in the economy
Still massive bankruptices to come in the retail sector in Feb/March 09
Still history can always be made, but i firmly believe you will get another chance to buy at the previous lows in the next 6 months and hopefully by that stage there a few more positive signs
Note also that the DOw always bottoms in the month when non-fram payrolls peak for the recession. Some may argue a figure of 533k is the peak loss. But i'd say post xmas lossess could easily top 1m.
problem is we cant pick when the peak job loss figure is until after the date.. yuo just have to go with yuor gut.... and my gut says that there will be massive job cuts in retail post xmas.
Obama's big infastructure plan is all well and good but the rubber wont hit the road there till late 09........precisely when i think we could be pulling out of this.
PS to achieve a Q ratio of 0.3x we need to hit 500 on SP.
Last edited by Footsie; 09-12-2008 at 09:04 AM.
If you're worried about falling off the bike, youd never get on.
-
10-12-2008, 02:47 PM
#143
Another book well worth a read is:
Tomorrows Gold - By Marc Faber
Faber is a student of economic history
The book covers a lot of theory on business cycles and long waves (kondratieff waves)
Written in 02-03
His predictions of what lay ahead at that time are surprisingly accurate
Much easier reading than Russell Napier's book
,
He who lives by the crystal ball soon learns to eat ground glass. (Edgar Fiedler)
-
10-12-2008, 03:05 PM
#144
 Originally Posted by Mick100

Another book well worth a read is:
Tomorrows Gold - By Marc Faber
Faber is a student of economic history
I've seen him on CNBC a lot of what he says makes perfect sense to me . . . especially his criticism of the US Fed and it's dreadful economic policy. Definitely worth an easy search on YouTube.
Regarding the USA, to a large extent what happens there . . . happens everywhere.
-
12-12-2008, 09:56 AM
#145
Originally Posted by Mick100
Another book well worth a read is:
Tomorrows Gold - By Marc Faber
Faber is a student of economic history
The book covers a lot of theory on business cycles and long waves (kondratieff waves)
Written in 02-03
His predictions of what lay ahead at that time are surprisingly accurate
Much easier reading than Russell Napier's book
,
Hi Mick
thxs, must have a look..sounds like a must read.
-
12-12-2008, 11:30 AM
#146
Has the bottom been reached?
Even though the DOW could not crack the 8950 resistance level, the lowest of many resistance levels within the 9550 -10000 band ...and as I post it has fallen 200 points back to high 8500's there has been some significant happenings today which is a plus for Equities.
More indicators are signaling a bear market bottom since I last posted #149 6dec2008
12...US$ trend reversal aids Commodity/Equity recovery No
change from NO to a maybe.
20...Credit interest very low tempts investors back to better returns property and Equities Not yet interest rates still falling.
some commentators are suggesting this scenerio .Even though the action is low the thought is growing.
21...Increase in secured Bonds activity Yes in NZ, don't know elsewhere
now changed to Yes
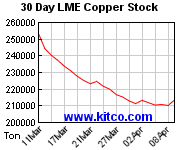
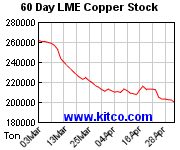
Spot copper prices is again today showing a decelerating downtrend pattern but is too early to say if prices has bottomed out
Conclusion: some more indicators is signaling that a bottom has been reached.
More commentators are cautiously thinking a bottom may have been reached including the old well known and respected Richard Russell (see below)

PETER BRIMELOW
Is it over?
Commentary: Signs suggest we may have seen worst of bear market
By Peter Brimelow, MarketWatch
Last update: 12:58 a.m. EST Dec. 11, 2008
 Comments: 341 Comments: 341
NEW YORK (MarketWatch) -- Gold up a lot, stocks up a little, bonds blah. Is it over, at least for now?
Dow Theory Letters' Richard Russell thinks it might be. He writes: "We may now be hitting the inflection point that I've been talking about. The selling of stocks could be exhausted, the deflation may be on the edge of turning into inflation -- today bonds were down, dollar was down, gold up strongly. The Bernanke-Paulson "re-inflation" efforts may finally have halted the fear and deflation syndrome -- now the trillions of dollars that have been introduced into the system may be close to setting off inflation. I said that the first hint of the change would be rising gold and declining bonds. We may be there."
At least for now, that is. Russell adds suspiciously: "Great bear markets tend to produce great contra-trend bear rallies. And I'm wondering whether the market isn't preparing for a major (false) bear market rally now. Please study the daily chart of the Dow Jones Industrial Average. ($INDU ow Jones Industrial Average ow Jones Industrial Average
News, chart, profile, more
Last: 8,761.42+70.09+0.81%
4:02pm 12/11/2008
Delayed quote data Add to portfolio Add to portfolio
Analyst
Create alert
Insider
Discuss
Financials
Sponsored by:
<img class="pixelTracking" width="1" border="0" height="1">$INDU 8,761.42, +70.09, +0.8%) Do you see the pattern of a head-and-shoulders bottom? If the Dow rallies above 9,000, the picture will begin to look bullish. And the current bearish sentiment will begin to change. The Transports are also in position to confirm any Dow breakout -- Transports have formed a potentially strong ascending triangle."
Russell has a strong long-term timing record according to the Hulbert Financial Digest. But in a tragedy worthy of Greek drama (I love writing about the investment letter business!) this octogenarian long-time superbear was finally enticed into bullishness last year, right at the top. See Sept. 19 column
As a result, his instincts are now even more afire.
Perhaps significantly, Russell's instincts are seconded, in a very short-term way, by Dennis Slothower, whose 2008 money-maker, Stealth Stocks Daily Alert, comments I am auditioning as a replacement for Russell's ... should the master decide to retire. See Dec. 4 column
Slothower wrote Wednesday night: "Stocks managed a moderate gain after a back-and-forth session that saw investors snapping up energy and materials stocks and dumping financial shares. It was interesting to see what led the stock market, as commodity stocks (such as energy and gold) rebounded a bit, giving the stock market a boost today.
"This focuses us back to the US dollar, which saw selling pressure. The U.S. dollar appears to have formed a head-and-shoulder formation, suggesting a correction in the dollar has begun.
"The implication of this suggests a rebound in the commodity stocks, which isn't too surprising given that OPEC meets next week and will likely cut oil production about 2 million barrels a day, according to the most likely scenario.
"A rebound in commodities would be bullish for the stock market on a near-term basis, as energy is a big weight in the indexes.
"Frankly, I am growing more optimistic with the market challenging its 50-day moving average but the indexes have to get past this technical barrier before investors take the bulls seriously, i.e., that they can do more than hold the market up for a few days ... I like what I am seeing but we aren't there yet."
This fits in with the Aden Forecast, among the most thoughtful letters. See Nov. 14 column
In their issue that arrived Wednesday, Mary Anne and Pamela Aden write: "We do not recommend selling now. Keep your resource and energy stocks in order to sell at a better price, assuming the stock market stays bearish. If it turns bullish, then we'll keep our stocks and/or adjust our positions. Watch the Dow Industrials ... it'll be positive above 8,900 but if it rises above 9,000 and then 9,600, the rebound rise will clearly be underway." 
-
12-12-2008, 02:12 PM
#147
Hoop
Richard russell is a nutter
He's one of these guys who calls the bear or the bull until he is eventually right...the all of a sudden he is a guru
Russell also said stocks were a buy in Jan 08!!!
I refuse to rely on others who are "guru's"
This time i will make my own judgement and deal with the consequences.
I still believe we will retest the lows in 2009.
If you're worried about falling off the bike, youd never get on.
-
12-12-2008, 10:46 PM
#148
Last edited by Hoop; 13-12-2008 at 10:38 AM.
Reason: grammar
-
13-12-2008, 11:05 AM
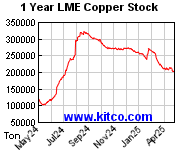
#149
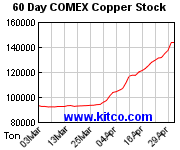
Update on the spot copper prices
From history, Copper has been a very reliable bottom picking indicator for Equities.
Copper prices still downtrending but the trend has again decelerated this week.
-
13-12-2008, 01:54 PM
#150
 Posting Permissions
- You may not post new threads
- You may not post replies
- You may not post attachments
- You may not edit your posts
-
Forum Rules
|
|


 Reply With Quote
 . We all misinterpret info at some stage..a part of being human I guess. Now my portfolio including cash is slightly in the red for this year with a red face to go with it :o because armed with hindslight HBY looks lousey so what was I thinking.


Bookmarks