-
23-12-2013, 11:47 PM
#301

Barring last minute black swans the mkt is recovering to finish pretty well this year ; pleased i ignored the noise and didn't sell up; atp. Good luck to all next year
-
24-12-2013, 08:06 AM
#302
 Originally Posted by Joshuatree

Barring last minute black swans the mkt is recovering to finish pretty well this year ; pleased i ignored the noise and didn't sell up; atp. Good luck to all next year
Yes it is eh Joshua .....and as Hoop says unusual for the market to reach new highs during a secular bear phase.
Sort of highlights the artificial (and probably unsustainable) effect things like QE have had on markets.
This thread is about investing in secular bear markets - wouldn't want to bre out of the market for a long period of time would we even though long term market returns are likely to be minimal
Like you Joshua I am stock specific, market trends just give a clue as to what may happen and as per Mr P's infamous market indicator some disciplines are need at different parts of the cycle. Sell on weakness if the chart says so .... like I did with FBU recently
In spite of the current noise one day, sometime, there will/may be a time when PE ratios are sub 10 .... are you prepared to preserve your capital if this happens
-
24-12-2013, 04:30 PM
#303
Originally Posted by winner69
Yes it is eh Joshua .....and as Hoop says unusual for the market to reach new highs during a secular bear phase.
Sort of highlights the artificial (and probably unsustainable) effect things like QE have had on markets.
This thread is about investing in secular bear markets - wouldn't want to bre out of the market for a long period of time would we even though long term market returns are likely to be minimal
Like you Joshua I am stock specific, market trends just give a clue as to what may happen and as per Mr P's infamous market indicator some disciplines are need at different parts of the cycle. Sell on weakness if the chart says so .... like I did with FBU recently
In spite of the current noise one day, sometime, there will/may be a time when PE ratios are sub 10 .... are you prepared to preserve your capital if this happens
Investing wise its hard to have gone far wrong by investing in the big long term trends
ie Aging populaion / Healthcare and companies benefiting from growth in asian middle class
Held the likes or RYMAN , CSL Ramsay healthcare , since long before the GFC and they barely blinked
-
24-12-2013, 06:57 PM
#304
-
25-12-2013, 03:32 PM
#305
Originally Posted by Hoop
An Open Letter to the FOMC: Recognizing the Valuation Bubble In Equities
John Hussman's fund record has been under-performing due to his very bearish stance over the last couple of years......Is it that the market stays irrational just long enough for the perma-bears to become bullish? ..anyway ... It seems he won't be on Janet Yellen's Xmas card list this year
Thank you for the post, Hoop. I found the Hussman Open Letter fascinating - in particular his assessment of November's Equity Bubble characteristics (which by now have become even more extreme):
1. margin debt at the highest level in history and beyond 2.2% of GDP (a level that was matched only briefly at the 2000 and 2007 market extremes);
2. a blistering pace of initial public offerings - back to volumes last seen at the 2000 peak and featuring “shooters” that double on the first day of issue;
3. confidence in the narrative that “this time is different” (in this case, the presumption of a fail-safe speculative backstop or “put option” from the Federal Reserve);
4. lopsided bullish sentiment as the number of bearish advisors has plunged to just 15% and bulls have crowded one side of the boat;
5. record issuance of covenant-lite debt in the leveraged loan market (which is now spreading to Europe); and
6. a well-defined syndrome of “overvalued, overbought, overbullish, rising-yield” conditions that has appeared exclusively at speculative market peaks – including (exhaustively) 1929, 1972, 1987, 2000, 2007, 2011 (before a market loss of nearly 20% that was truncated by investor faith in a new round of monetary easing).
This does not bode well for Equity markets in 2014, although given recent reforms in China and turnarounds in Japan those two markets may fare better than most. Also, as money flows from Equities to Precious Metals the ASX may find good support in that sector. The NZX will be hit along with most other sharemarkets. It's not a matter of If but When...and your guess is as good as mine. Hussman is picking next month. He may not be far wrong. At the latest, I would say April.
Discl: 70% of my portfolio is now in precious metal stocks.
To foretell the future, one must first unlock the secrets of the past.
-
25-12-2013, 03:44 PM
#306
Also worth highlighting is Hussman's assessment of the dangers of continuing with QE:
Quantitative easing:
1. undermines planning, as every economic decision must be made in the context of what the Federal Reserve may or may not do next
2. starves risk-averse savers, the elderly, and the disabled from interest income
3. lowers the bar for speculative, unproductive, low-covenant lending (as it did during the housing bubble)
4. relaxes a constraint that is not binding – as there are already trillions of dollars in idle reserves at U.S. banks, on which the Federal Reserve pays interest both to keep them idle and to avoid disruptions in short-term money markets
5. undermines price signals and misallocates scarce savings to speculative pursuits
6. further skews the distribution of wealth, and while the extent of this skew has a scarce chance of persisting, the benefits of any spending from transiently elevated stock market wealth will accrue to primarily to higher-income individuals who are not as constrained as the millions of lower-income, low-asset families hoping for some “trickle-down” effect.
We have seen numerous variants of this movie before, and we should have learned the ending by now.
7. Importantly, the magnitude of the “wealth effect” on employment is dismally small. Even if the entire relationship between stock market fluctuations and employment fluctuations was causal and one-directional, it would still take a roughly 40% advance in the stock market to draw the unemployment rate down by 1%.
Unfortunately, price advances do not create the underlying cash flows to support them, so the strategy of manipulating stock prices higher also involves a piper that must be paid."
IMO, the Fed has overplayed its role to increase hugely the profits of large corporates (especially Banksters), whilst at the same time has been negligent in delivering on the two mandates earlier set them by Congress w.r.t. Unemployment and Inflation. But boy, do they know how to play the media, pulling strings where and when they choose to do so. Hopefully Congress is better informed and so not so gullible in their upcoming 100 anniversary review of the structure, purpose and mandate of the Fed. Now that will be an interesting power play.
...but for now, I must get prep'd the Christmas dinner. Offline for now. A seasonal cheer to y'all.
BC
Last edited by Bobcat.; 25-12-2013 at 03:50 PM.
To foretell the future, one must first unlock the secrets of the past.
-
01-03-2014, 01:40 PM
#307
Hi Bobcat ..a belated merry xmas to you
Yes Hussman's "loud haler" call is ignored by the markets as optimism and the sense that's all's well within the market place and the economy comforts investors by taking away their worries..
Yep that's where the paradox comes in...the bull dies when no one worries...
I overlayed the VIX onto the long term S&P500 chart showing 3 bull markets and 2 bear market cycles....
It seems the time to start worrying is when everyone is not worried and the time to stop worrying is when everyone is worrying....Buffett strategy in a chart...eh?

Last edited by Hoop; 01-03-2014 at 01:42 PM.
-
11-03-2014, 08:27 AM
#308
Article from Seeking Alpha 10th March 2014
 Cam Hui Cam Hui
Mutual fund manager, bonds, ETF investing
Profile| Send Message| Follow (4,735)
New All-Time Highs = Secular Bull Market?
Mar. 10, 2014 5:56 AM ET | 6 comments | Includes: BXDB, BXUB, BXUC, CRB, DIA, EPS, FEZ, IVV, QQQ, RSP, RWL, SDS, SFLA, SH, SPXU, SPY, SSO, TRND, UPRO, VOO
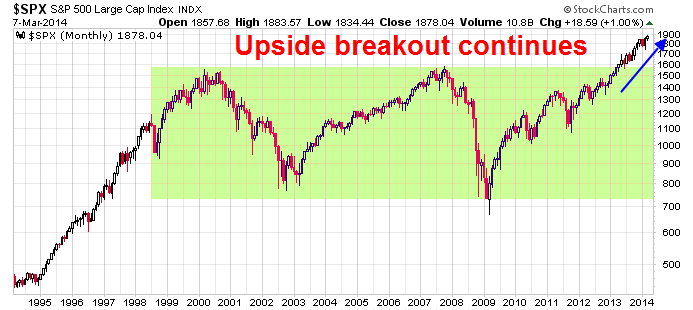
Five years after the market bottom in 2009 (also see my cautiously bullish Phoenix rising? post on February 24, 2009), the SPX rallied to new all-time highs last week. Last year, this index decisively staged an upside breakout from a trading range that stretches back to the NASDAQ top in 2000.
Here's a key long-term market question. Is it time for the secular bear camp to throw in the towel and call this stock market a new secular bull?
(click to enlarge)
Elevated valuation
The technical evidence is certainly there, but my inner fundamental investor remains conflicted because valuations are elevated. Doug Ramsey of Leuthold Weeden Capital Management recently penned an article on this very topic showing his (and my) certainty. First of all, Ramsey wrote that some analysts consider the 666 low on the SPX to be low enough for a secular bear low compared to market history:A handful of analysts have contended the March 2009 low was not secular in nature-although their ranks thinned considerably in 2013. They claim the 2000-09 decline was simply too short to sufficiently purge the excesses built up during history's most powerful secular bull. They have a point: The four previous secular bears lasted from 12 to 17 years even though all four commenced from far less inflated valuations than those recorded at the 2000 peak.
Similarly, the remaining secular bears argue that U.S. stock market valuations never sank to levels befitting a true secular buying point. That's debatable. At the intraday low of March 6, 2009 (the infamous "666"), the SP 500 traded at just 10.1x our 5-yr. Normalized EPS estimate-only half a point above the median P/E of 9.6x seen at the last four secular bear market lows. Close enough for government work, in our view. On the other hand, the SP 500 dividend yield at that historic low amounted to just half the median of 6.7% seen at the prior four lows. He went on to qualify those valuations on the basis of the low interest rate regime:We expect that the March 2009 levels reached by essentially all of our key U.S. valuation measures will prove to be lasting secular lows. In the context of zero interest rates and (at the time) zero inflation, it was probably unreasonable to expect valuations to match those seen in conjunction with the double-digit interest rates and inflation at the 1982 low. Ramsey expressed his concerns about current valuation levels:Our concern is not with the troughs of 2009, but where those valuations stand a mere five years into the supposed secular upswing. Even the P/E on forward EPS-though not a serious valuation tool-has returned to its late 2007 highs, and those measures with actual predictive ability don't look any better.
All six of the accompanying valuation ratios are strongly (and negatively) correlated with subsequent 10-year stock returns, and the least extreme among them (the SP 500 12-Mo. Trailing P/E) still stands higher than about three-quarters of its history-with those earnings lifted by margins higher than 100% of their history. Three measures (Price/Cash Flow, Price-to-Book, and Price/Dividend) have moved into their ninth historical decile, and the SP Industrials Price/Sales ratio is now on a path into late-1990s bubble territory. Whither corporate margins?
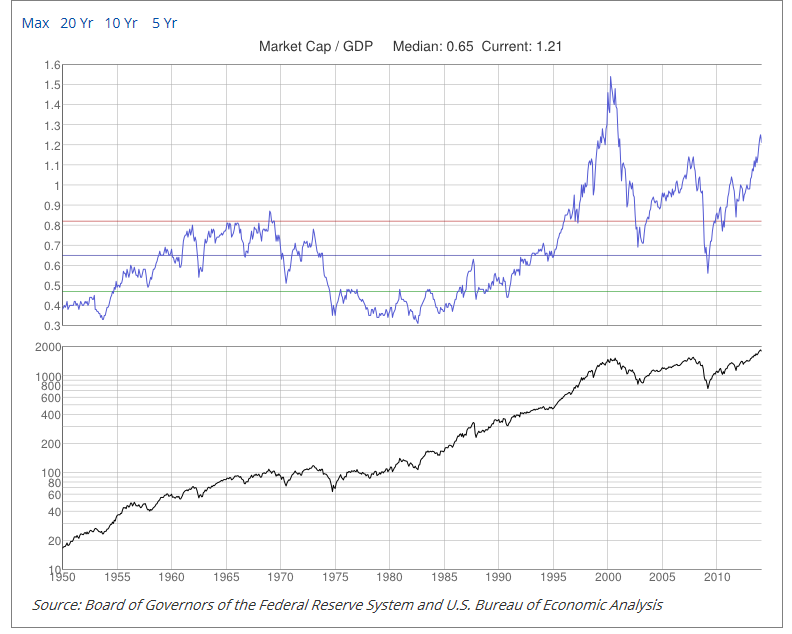
I feel Ramsey's pain. Secular bulls don't tend to launch themselves with valuations at elevated levels like these. Consider, for example, the market cap to GDP metric as a proxy for the Price to Sales ratio. This metric remains elevated and has surpassed its pre-Lehman Crisis highs:
(click to enlarge)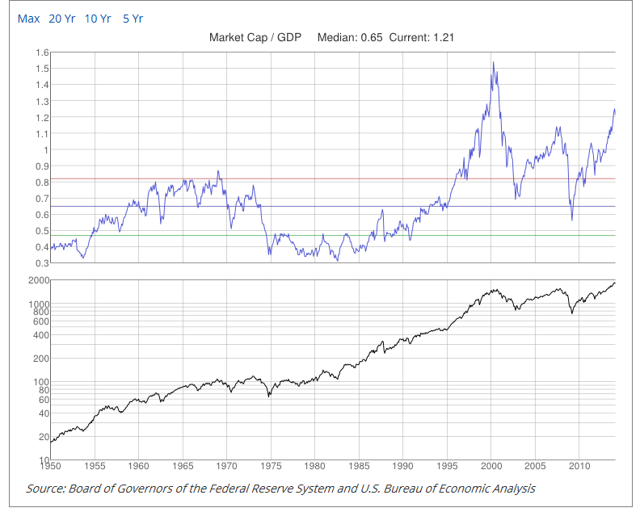
There have been a number of warnings on this so-called favorite valuation metric of Warren Buffett. As an example, Forbes wrote about these concerns in a recent article:
The ratio today is 115.1% of the $16 trillion GDP. In the year 2000, just before the market cracked in the dot-com bubble, the market capitalization was 183% times the GDP, according to a chart published recently.And in 2007, just as the housing credit bubble was bursting, the ratio was 135% times the GDP. These are all times when the stock market looks overvalued.
Then, the buying point for stocks was reached in March 2009 when the ratio of market cap to GDP was only 73%. The numbers were somewhat different in 1929 when the market cap already was in decline and amounted to 81% of GDP, but fell precipitously to 25% of a ruinous GDP in 1933.
By comparison, in the bear market of 1975 the ratio of stock valuation to GDP was 75%, definitely a buy signal if you were Berkshire Hathaway. Even a better opportunity was 2009 when the ratio of stock valuation to the economy fell to 50%. It was shooting ducks in a barrel and Buffett said so publicly several times.
Jesse Felder (via Business Insider) highlighted a warning that Warren Buffett made about corporate margins in 1999:"In my opinion, you have to be wildly optimistic to believe that corporate profits as a percent of GDP can, for any sustained period, hold much above 6%. One thing keeping the percentage down will be competition, which is alive and well. In addition, there's a public-policy point: If corporate investors, in aggregate, are going to eat an ever-growing portion of the American economic pie, some other group will have to settle for a smaller portion. That would justifiably raise political problems-and in my view a major reslicing of the pie just isn't going to happen."
-Warren Buffett Here is a difficult question for those in the secular bear camp. Buffett made those comments in 1999. Why has he said nothing since then about corporate margins? His silence on this issue has been deafening.
New secular bull = New stock market bubble?
Here is a difficult question for those in the secular bull camp. What's the upside from here? Ramsey of Leuthold Weeden Capital Management projects limited upside under a secular bull scenario, even assuming that everything goes right:
If the current cyclical bull unfolds into a secular one that is perfectly average in duration and magnitude (a very tall achievement, in our book), the annualized total return over the next ten years will still be a bit below the long-term average return of 10%. Frankly, we don't find this all that compelling, considering all that must go according to plan for the market to achieve it (i.e. sustained EPS growth at a healthy 6% and an inflated terminal P/E multiple).
He added some of these gains depends on assuming the resumption of a stock market bubble:
Based on the relative positions of these time-tested measures, secular bulls seem to be implicitly betting on the reflation of a multi-generational stock bubble less than 15 years after it popped. The pathology of "busted bubbles"-which we've detailed at length in the past-doesn't support that bet.
A cyclical bull, a secular ????
When he puts it all together, my inner investor thinks that, if we are indeed seeing a new secular bull market, the extraordinary measures undertaken by global central banks in the wake of the Lehman Crisis has front-end loaded many of the gains to be realized in this bull. There is, however, a silver lining to this outlook.
In the meantime, we are in the midst of a global cyclical bull, so enjoy it. I can point to the many positives highlighted by Jeff Miller in his latest weekly commentary, such as improving eurozone PMIs, the ISM beat last week, improving employment, etc.
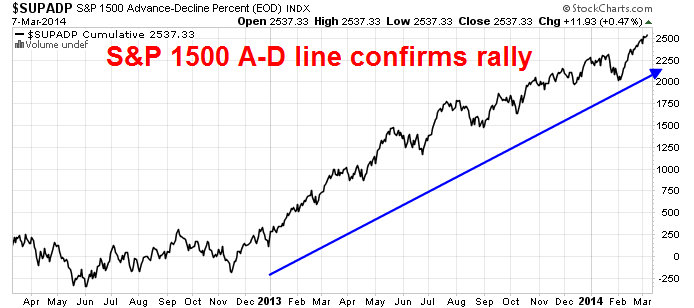
From a technical standpoint, continued strength in breadth indicators such as the Advance-Decline Line has confirmed last week's new high in U.S. equities (see my commentary on breadth analysis in What bad breadth?):
(click to enlarge)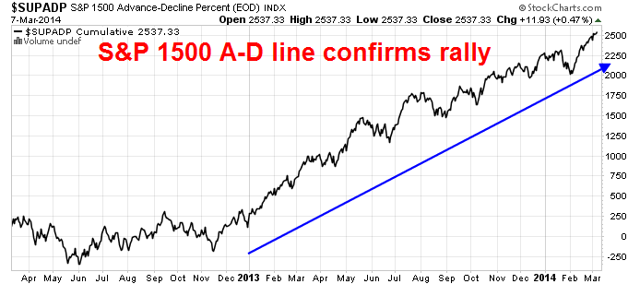
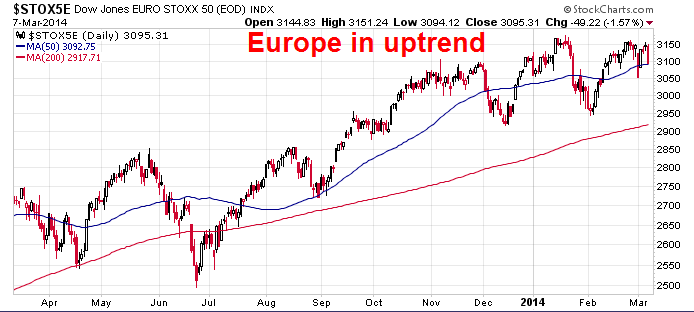
Eurozone equities remain in an uptrend:
(click to enlarge)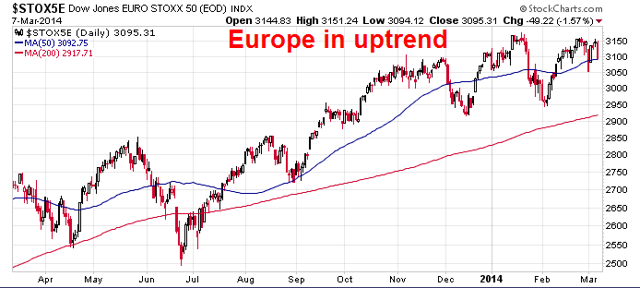
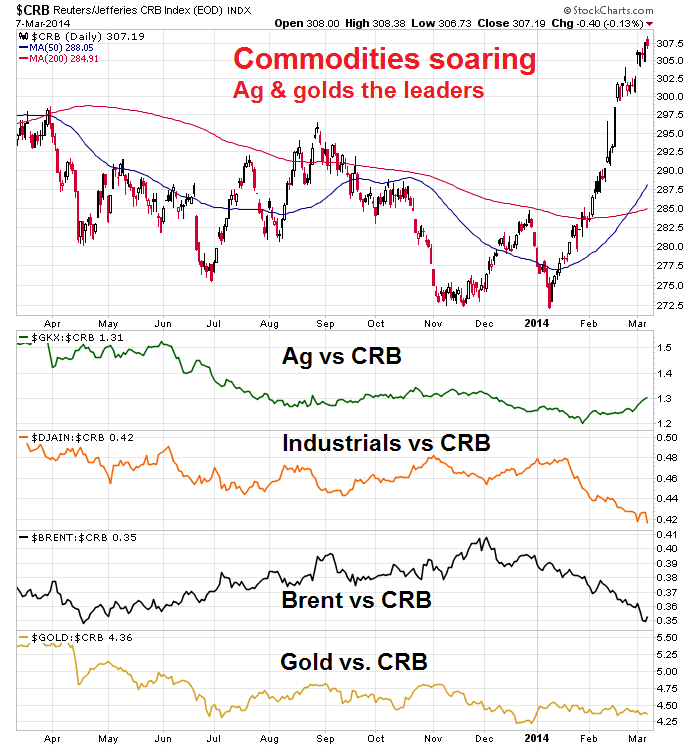
Commodities are rallying, though the leadership is somewhat unusual as it has been led by the agricultural commodities and gold (for further discussion see What fundamentals drove the equity rally?):
(click to enlarge)
These are all signs of a cyclical global bull and the question of whether it's a secular bull can wait another day. So don't worry, be happy.
Cam Hui is a portfolio manager at Qwest Investment Fund Management Ltd. ("Qwest"). The opinions and any recommendations expressed in the blog are those of the author and do not reflect the opinions and recommendations of Qwest. Qwest reviews Mr. Hui's blog to ensure it is connected with Mr. Hui's obligation to deal fairly, honestly and in good faith with the blog's readers."
Last edited by Hoop; 11-03-2014 at 08:28 AM.
-
22-03-2014, 04:20 PM
#309
We know that we cannot predict markets. Only things that we know is bull markets follow by bear markets or correction. Bear markets follow by bull markets. Are we going to get secular bear market, temporary bear market or correction?
Are we in current secular bull market or one of the bull markets in a secular bear market? What is the best strategy that we can apply now? Thanks
-
22-03-2014, 10:33 PM
#310
Originally Posted by MARKETWINNER
We know that we cannot predict markets. Only things that we know is bull markets follow by bear markets or correction. Bear markets follow by bull markets. Are we going to get secular bear market, temporary bear market or correction?
Are we in current secular bull market or one of the bull markets in a secular bear market? What is the best strategy that we can apply now? Thanks
Hi Marketwinner....
The majority of the researchers think we are in a cyclic bull market cycle within a secular bear market cycle...What has questioned many researchers lately is that many people wrongfully perceive that secular bear market cycle are always "characterised" by oscillations with market index price flat tops in other words the market loses its very long up trend during these bear periods. This is often the case but unfortunaely for these people the problem this time is that the market has risen above its perceived top and created new record highs and therefore it's up trending..What these people have to remember (because they always forget and erronously think its different this time) is that cyclic cycles are governed by price trends and reversals but Secular cycles are governed not by the price trend but by Annualised PE Ratios (CAPE) trends..
Whats the best investment strategy within a Secular bear market cycle....a "rowing" strategy...A "sailing" strategy ( buy and hold variations) is the best option in secular bull market cycles...
Sailing/Rowing Strategies Video (7min 49 sec)
I have written some posts about the All Ords having a tremendous run from 2003 to 2007 creating a high that one would expect from a secular bull cycle ..yet it was in a secular bear cycle...Looking closer at the All Ords at that time the Annualised PE Ratio was in fact falling (the true characteristic feature of a secular bear cycle)...It was the stronger than normal earnings growth forcing up the index price that masked the Secular bear market cycle ...
It seems the S&P500 is doing an All Ords this time...with spectacular earnings growth.....also helping is the annualised PE Ratio (CAPE) being a lot higher than "normal" within its secular bear cycle due to 2 factors:...
1.. being in a "sweet spot" due to low inflation (the sharemarket driver)
and
2 ..the long term degassing effects from the 1999 -2000 Equity Bubble (see how high that PE ratio was...it has taken 13 years to fall back to still high levels of today)
copied chart from Post #319

Last edited by Hoop; 22-03-2014 at 10:44 PM.
 Posting Permissions
- You may not post new threads
- You may not post replies
- You may not post attachments
- You may not edit your posts
-
Forum Rules
|
|


 Reply With Quote


Bookmarks