-
11-10-2014, 01:31 PM
#331

I hear the call from all corners from financial journals to forum sites that Equities are just correcting so no worries...The big excuse is Equities will bounce back to form new highs because the economy is booming.
This present correction could just do that, fall and bounce to new highs....Hmmm but is it a forgone conclusion?
Crestmont Research says the Equity market and the economy don't correlate very well..The main driver of the stockmarket is the cyclic nature of the PE ratio which is itself driven mainly by inflation...Hence Low inflation supports a higher than "normal" P/E Ratio as we have today.
So we can take logic from Crestmont's point of view that rising inflation due to a booming economy points downward pressure on the stockmarket's P/E ratio ...If the economy is still rapidly growing there is a good chance company earning are growing too, thereby offsetting and possibly negating the downward pressure of the P/E and index prices will still rise...
But what happens when the earnings get affected by rising interest rates to combat inflation and new competitive entrants enter the market to take advantage of the good times and create tighter margins...The share Market will initially be affected by this, yet the economy may not...therefore the sharemarket could be viewed either as a leading indicator or there's no correlation between the two
So...the Million Dollar question.. Is this just a healthy bull market correction and the economy will keep going upwards for years to come ...OR....is the Stockmarket signalling something much more sinister?
We all know or should know by now for those with experience with past recessions that sharemarkets usually don't correlate with the economy when in the depths of recession...The old rule of thumb is the sharemarket will rise after the economy is 66% through its recession..Is Shanghai experiencing is effect?
An old writer Doug Short also observed this pattern His article below is from http://www.advisorperspectives.com/d...Recessions.php
His website has been operating for 10 years and has some good articles on it..good educating stuff..see http://www.financialsense.com/contributors/doug-short
One of his other must read articles Is the Stock Market Cheap? it makes for very sober reading
Hoop
---------------------------------------------------------------------------------------------------------------------------------------------------------------------------------------
The S&P 500 and Recessions
October 8, 2014
by Doug Short
- e The Discussion on

Note from dshort: Yesterday Political Calculations posted a fascinating article entitled Dividends: A Resurgence of Recessionary Conditions, which studies the correlation between recessions and the number of companies per month announcing dividend cuts. The article prompted me to update my long-term look at the S&P 500 and recessions.
What is the relationship between the market and recessions? Is there are causal relationship between the two? Does a recession lead to a decline in the market, or does a market decline foreshadow a recession?
As a first wave Boomer, I've lived through eleven official recessions as determined by the NBER, and I have distinct memories of recession stresses as far back as the 1957-1958 downturn. My father was a painting contractor in Daytona Beach, Florida. A recession forced cuts to our household budget that didn't go unnoticed by a pre-teen (e.g., the food on our table).
For a quick look at the market-recession correlation since the mid-1950s, here is a chart of S&P 500 daily closes stretching back to the launch of the index in 1957. I've also highlighted recessions.
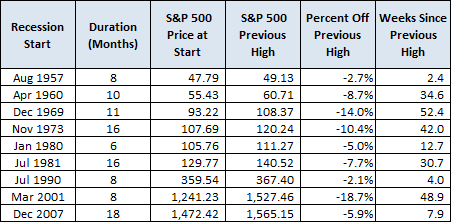
The table in the chart above shows the index close on the first day of the months determined by the NBER as cycle peaks and trough for the nine recessions since 1957. Four of the recessions saw the index higher at the end of the recession than the start. In most cycles, the index peaked long before the recession start and bottomed before the end.
To get a better idea of the lag between recession starts and index peaks, I've charted the same index using a "percent off high" technique. In other words, I plot successive new index highs at zero and the cumulative percent declines of days that aren't new highs. The advantage of this approach is that it helps us visualize declines more clearly and facilitates a comparison of the depth and duration of declines across time.
Since the inception of the S&P 500 in 1957, there have been 9 recessions and 9 bear markets (20% or greater declines). However, three bears were not associated with recessions, and three recessions happened without a bear market, although the 1990-1991 recession had the ultimate "near" bear with its 19.9%.
Here is a table showing the key data: Recession starts, the index price on the first market day of the recession, the previous index high, the percent off the previous high at the recession start, and the number of weeks from the previous high to the recession start.
Some Observations
Market indexes and recessions are two very different data series. The closing price of the S&P 500 is a real-time snapshot of equities. In sharp contrast, recession boundaries are determined many months, sometimes a year or more, after the fact, for both the starts and ends (peaks and troughs). The NBER makes its call after lengthy deliberations over economic data that has been subjected to extensive revisions.
Economists often make generalizations about business cycles that suggest a substantial commonality among them. But that's true only at a 20,000 foot level (and on a partially cloudy day). Recessions are dramatically different from one another if viewed within their individual economic and market contexts. Exogenous events can play a role, as in the case of the 1973 Oil Embargo. The prevailing inflation rate can be a key difference maker e.g., the double dip recessions in the early 1980s. I would also suggest that demographics can be a determinant in recession's personality. For example, compare the demographics of the Boomer cohort in the 1970s and 1980s, in their earlier careers, with the aging Boomer workforce during the last recession, when an alternative to unemployment was early retirement.
The US economic recovery since the official trough in June 2009 has been weaker than hoped, and there are many financial pundits who agree with ECRI's latest assertion that a new recession is underway, a view which, I would counter, is not supported by the Big Four economic indicators.
We will, of course, eventually slide into a recession. It's an inevitable part of the business cycle. But the data presented here illustrates that the relationship between the market and recessions varies widely. Investment planning based on recession forecasting is definitely not a foolproof strategy.
-
13-10-2014, 05:32 PM
#332
Hoop, I don't know how you manage to absorb and decipher so much information.....I would have given up long ago given your level of engagement.. Admire your work ethic that's for sure.
-
14-10-2014, 08:04 AM
#333
I second that
Good stuff Hoop
-
01-01-2015, 02:39 PM
#334
Hi Everyone
Happy New Year
A post on the 1st day of 2015...Like all investors we try to figure out what 2015 has in store for the Equity markets..
Since 2009 Wall St has seen one of its longest cyclic bull market taking place..and breaking all sorts of Secular Theory boundaries and expectations in the process....So whats happened this time?..Do these Secular Fundamental abnomalities suggest a dangerous invisible bubble that investors don't want to see has formed?? Is the Secular Theory Discipline flawed?? or (the famous last words) It all different this time??
Many answers but nothing really to show one way or the other..
Perhaps the wheels of this 6 year bull market cycles won't suddenly fall off alerting investors to preserve their capital gains...maybe in 2015 a scenario could be that there will just be bits and pieces falling off the cyclic wheel until the Bull market cycle no longer functions causing a very slow and painless evaporation of the complacent investors capital...
The chart below shows shows the S&P500 overlayed with the NYA200r showing at the moment there is less stocks now contributing to their index's rallies than for the whole 6 year Bull Market Cycle that is currently in progress...Is this a sign that the "bits and pieces" are starting to fall off ???
Normally 70+% and mostly about 80% of the stocks are in the bull zone (above their MA200) and contribute to their index rally's.
Since October an abnormality has happened, only 58% of the stocks are in the bull zone and contributing to the latest index record highs..What this suggests is that 42% of the stocks
within the S&P500 are in a primary Bear tide.
Is this a sign of S&P500 index cyclic deterioration??....Time will tell

Last edited by Hoop; 01-01-2015 at 02:51 PM.
-
01-01-2015, 03:09 PM
#335
Interesting chart in this article.
Doesnt show the secular bull and bear cycles but graphically shows why you want to be out when the bears take over
http://www.businessinsider.com.au/il...arkets-2014-12
This Is The Best Illustration Of History's Bull And Bear Markets We've Seen Yet
-
01-01-2015, 10:03 PM
#336
 Originally Posted by winner69

Interesting chart in this article.
Doesnt show the secular bull and bear cycles but graphically shows why you want to be out when the bears take over
http://www.businessinsider.com.au/il...arkets-2014-12
This Is The Best Illustration Of History's Bull And Bear Markets We've Seen Yet
Winner..I don't think the chart is accurate....A quick look at that chart and I see 2 bull markets which are too long..I think there was a bear market cycle 1946 to 1949 and there was a 30% drop in 1981-1982..I could be wrong but I don't think I am....Most commentators say an average lifespan of a bull cycle is about 4.7 years long so that lifespan figure makes sense if I'm right.
I do agree with the author in saying that overall the market is more often in a bull cycle than a bear cycle...and that is the major point I think that he is making.
Last edited by Hoop; 01-01-2015 at 10:08 PM.
-
04-01-2015, 04:08 PM
#337
Can we see beginning of bear market in 2015 or strong correction as predicted by Prof. Siegel?
http://www1.realclearmarkets.com/201...15_160941.html
December 9, 2014
Prof. Siegel: Expect a Big Stock Market Correction in 2015
-
04-01-2015, 06:13 PM
#338
The chart below is up to the 2nd Jan 2015..So the CAPE for the S&P500 at the time of this post is at 27.02...That is considered extremely high and very risky from the risk v reward point of view..
Interesting thing is that these secular indicators such as CAPE can defy gravity for some considerable time (That is the meaning of Secular, a long period of time)...The CAPE was around 26.5 to 27.5 for 3 years between 2004 and 2007...Anyone leaving the market because CAPE was at the dangerous 26+ bubble point would have been frustrated for 3 years...Its true that CAPE identifies overvalued markets but the market can stay irrational for a long time upsetting the timing of any rational analysis...
Also of interest is the Secular Bear Market Cycle which has been running since the year 2000 has a down trending CAPE signature as did all previous Secular Bear Market Cycles...so at some point in time the market will unseize itself and correct downwards (not upwards) because that is its secular signature... What will be the factor that finally triggers the market reversal? Hoop thinks it could be anything... a range from a large event such as a crisis to that of an individual insignificant grain of sand dropping on to an Equity pile collapsing that structure due to the sheer overall weight of downward pressure..The butterfly effect...
When will the Market correct (secularwise- using CAPE)?....As you can see from the chart below, around CAPE 27 seems to be crash point downwards..however these CAPE tops are made up of many years ..long enough for the investor/analysis/broker/media to convince themselves that the secular theory doesn't work, they know more about market behaviour as it is very different this time...So...one can see how complacency appears at the tops of cycles sucking in the most conservative and fearful investors and causing the incumbents to stay in and accumulate more on market weakness, even doing so in a state of denial when a new cyclic bear cycle commences...You hear the more experienced investor say they will exit when the Bull cycle reaches its top point...I (Hoop) say this will never happen and most will stay in and crash and burn as it has happened over and over again in the past...History repeats and most don't learn from it..that non-learning is why history repeats..eh!!
Below the chart is an article from MarketWatch dated 18 August 2014
S 
The Tell
The Markets News and Analysis Blog
Robert Shiller tries to understand why stocks are ‘very expensive’
August 18, 2014, 11:04 AM ET
Share: More
Email Print
 Bloomberg “The United States stock market looks very expensive right now.” And with that, Yale professor Robert Shiller is at it again, telling us to worry.
He’s got plenty of company these days among those who fear this bull market can’t possibly keep going. Shiller’s particularly uncomfortable about the CAPE ratio (cyclically adjusted price-earnings), a stock-price measure that he helped create. He said something similar in June. (Just Google Robert Shiller bubble for more instances of his bubble theories.)
Otherwise known as the Shiller P/E, the ratio basically takes average inflation-adjusted earnings for the S&P 500 SPX over the previous 10 years. In Shiller’s New York Times article from Saturday, he notes that when he touched on this topic over a year ago, that ratio stood around 23, far above its 20th-century average of 15.21. It now stands at 25, a level that since 1881 has only been surpassed in three other periods — the years surrounding 1929, 1999 and 2007. And we all know what came next after the market peaks in those years.
Shiller says the CAPE was never intended to indicate timing on when to buy and sell, and that the market could remain at these valuations for years. But given that this is an “unusual period,” investors should be asking questions, he says.
His question: Given that the ratio shows valuations have been elevated for years, are there legitimate factors that could keep stock prices high for decades longer? He points that his own questionnaire surveys show investors are getting more worried. Other than that, unfortunately there is no “slam-dunk” explanation for these high valuations, says Shiller.
“I suspect the real answers lie largely in the realm of sociology and social psychology — in phenomena like irrational exuberance, which, eventually, has always faded before,” says the Nobel-Prize winner. “If the mood changes again, stock market investments may disappoint us.”
Analysts at Bank of America Merrill Lynch said they remain constructive on the S&P 500, which is trading at a forward P/E multiple of just over 15. They said that’s not out of whack with its historical average, though, of course, they don’t address the Shiller P/E.
On Main Street (otherwise known as the reader comments attached to the New York Times article), theories abound:
“…The liquidity pumped in by the Fed is making valuations based on fundamentals impossible…” — Ashwin Kalbag.
“…Many are concerned that they might lose their jobs to cost-cutting, or that they might eventually be replaced by a computer or robot or website. Such anxiety might push them to try to make up for these potential shortfalls by investing in stocks and bonds — even if they worry that these assets are overvalued.” — david
“…Stocks are all we have. And there is a lot of cash on the sidelines to support values.” RBA
And one reader pointed out that really, what on earth do you do with Shiller’s type of analysis if you’re a truly long-term investor, thinking 10 to 40 years ahead?
“…I had a friend who, in around 1997, looked at ratios like Shiller’s and cashed out of stocks when the Dow approached 6,000. He was absolutely right, the market was severely overvalued — but meanwhile, the Dow zoomed to 11,000 — and even in the great correction of 1999-2000 never sniffed 6,000 again. ” — Tom
Last edited by Hoop; 04-01-2015 at 06:37 PM.
-
08-01-2015, 12:29 PM
#339
Actually the ultra-low interest rate environment has brought both good and bad. In the Euro Zone, Germany is doing well compare with other countries. Growth in Russia and Ukraine also will slow down further. Russia’s next option is raise money selling part of their gold reserve to overcome their economic woes as they have affected from falling oil prices and RUBLE. In every situation some sectors will benefit and some sectors will affect badly. Overall we can expect more volatility in asset prices in 2015 and we may see bottom for some assets in 2016 provided we don’t see the long depression. Demand driven stocks, currencies, commodities and other assets will go up in the long run. Moreover, some things are necessary such and food and drink. Demand for hard commodities may drop due to slower growth in some sectors in China but demand for some food and beverages will go up in the coming decade due to increased population in Asia. It is time to identify emerging commodities, currencies and stocks and other assets. Finally some gurus also make mistakes. Only thing we can learn is what happened in the past will repeat in the market in a different manner. Boom will end with bust and bust will end with boom. Early identification of business cycles, market cycles, currency cycles and commodity cycles are very important.
http://www.bloomberg.com/news/2015-01-07/e...ral-mounts.html
Euro-Area Deflation Risks Mount with Falling Consumer Prices
DYOR
-
15-01-2015, 11:04 AM
#340
Mauldin still not too sure where we are but whatever we be OK by 2020 if not wiped out in e anytime
5. I do not believe that the secular bear market in the United States that I began to describe in 1999 has ended. Secular bull markets simply do not begin from valuations like those we have today. Either we began a secular bull market in 2009, or we have one more major correction in front of us. Obviously, I think it is the latter. It has been some time since I’ve discussed the difference between secular bull and bear markets and cyclical bull and bear markets, and I will briefly touch on the topic today and go into much more detail in later letters. For US-focused investors, this is of major importance. The secular bear is not something to be scared of but simply something to be played. It also offers a great deal of opportunity. If I am right, then the next major leg down will bring on the end of the secular bear and the beginning of a very long-term secular bull. We will all get to be geniuses in the 2020s and perhaps even before the last half of this decade runs out. Won’t that be fun? Let’s call the end of the secular bear a 90% probability in five years and move on.
http://www.mauldineconomics.com/fron...sunami-warning
 Posting Permissions
- You may not post new threads
- You may not post replies
- You may not post attachments
- You may not edit your posts
-
Forum Rules
|
|


 Reply With Quote


Bookmarks