-
22-12-2009, 09:24 AM
#561

 Originally Posted by belgarion

Hi Belg
Hmmm ....seemed a credible article up until nearly the end..but... when I saw that notoriously erroneous PE Ratio chart which keeps on popping up to support a writers bear argument.. all credibility was lost
-
22-12-2009, 10:53 PM
#562
Junior Member


This chart unless a giant headfake suggests we go a lot higher
inverse head and shoulders is circa 1220 on the s&p
-
23-12-2009, 07:46 AM
#563

 Originally Posted by Gee Bee


This chart unless a giant headfake suggests we go a lot higher
inverse head and shoulders is circa 1220 on the s&p
I've got a red cross?
-
23-12-2009, 11:03 AM
#564
Last edited by Hoop; 23-12-2009 at 11:09 AM.
-
04-01-2010, 09:25 AM
#565
-
11-01-2010, 07:57 PM
#566

 Originally Posted by belgarion

Load up and go long.
Belg, a contrarian seeks opportunities to buy or sell specific investments when the majority of investors appear to be doing the opposite..... ie they buy in downtrends and sell in uptrends. You can't advocate "loading up and going long" when the herd is thundering North and claim to be a contrarian!
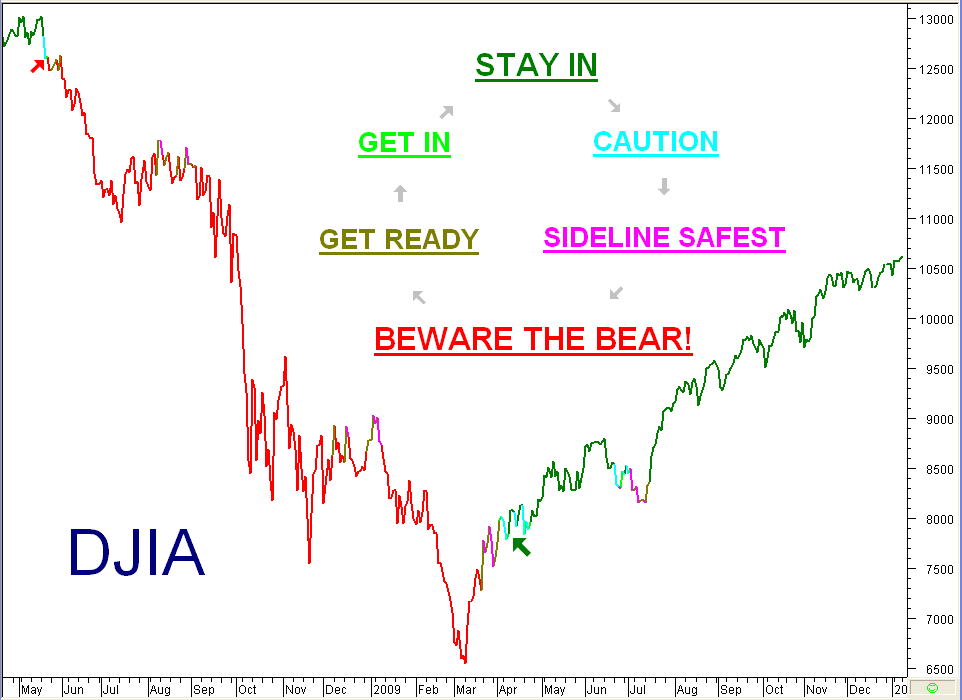
Market Strength Indicator chart update :-

-
17-01-2010, 09:07 PM
#567

P's chart will still be green
Heres something from Chart of the Day .... this rally is by historicall terms almost a non event ..... a long way to go yet
Quote ..... all major market rallies of the last 110 years are plotted on today's chart. Each dot represents a major stock market rally as measured by the Dow. As today's chart illustrates, the Dow has begun a major rally 27 times over the past 110 years which equates to an average of one rally every four years. Also, most major rallies (73%) resulted in a gain of between 30% and 150% and lasted between 200 and 800 trading days -- highlighted in today's chart with a light blue shaded box. As it stands right now, the current Dow rally (hollow blue dot labeled you are here) has entered the low range of a "typical" rally and would currently be classified as both short in duration and below average in magnitude.
-
22-01-2010, 06:38 AM
#568

Bad times on the DOW tonight. Down 220 (2%) points at the moment.
P, has this changed your chart from "Stay in" to "Caution"...it must be close.
-
23-01-2010, 10:12 AM
#569
-
23-01-2010, 12:41 PM
#570
 The overdue BM Correction in progress??? latest close 10173 The overdue BM Correction in progress??? latest close 10173
 Originally Posted by Hoop

As I write the DOW closed at 10407 (+136).
The 50% Fibonacci has been breached. the primary downtrendline is under threat and the Market correction due point has been exceeded.
What is so important is that all these points are happening at this period of time and creates a large resistance for the DOW to leap over. it seems today the DOW's rise today is remarkable as it is against the chartists odds. The chartists last week were expecting a fall of the DOW index this week as they were assuming a respect of these lines and points. Even though today's rise is big and enthusiasm is abound with sideline money starting to enter the Equity market..there are still the same warning bells going off for a bull market correction to happen.
If the DOW keeps rising there is another big hurdle looming, the strong resistance line (orange 10650) created back in the previous bottoming out in 2002/2003 That resistance line is the Feb 2002 Feb 2004 necklines of that inverse H&S formation.

No point in a new chart..this 2 months old one I posted way back tells the story
Note:...its the distance that counts not time..... BM Correction warning point of 10350 (green dotted line) about 4% error ...not a bad error rate . .
Note:- Typical BM Correction "rule of thumb" sign...by the time you realise it is a BM correction half of the correction has already happened
Watch Monday (Wall St time) for a kicker....may or may not happen.
Last edited by Hoop; 23-01-2010 at 12:46 PM.
 Posting Permissions
- You may not post new threads
- You may not post replies
- You may not post attachments
- You may not edit your posts
-
Forum Rules
|
|

Bookmarks