sharetrader
Page 59 of 107 FirstFirst ... 94955565758596061626369 ... LastLast
Results 581 to 590 of 1069

Thread: Dow

  1. #581
    Senior Member
    Join Date
    Jul 2002
    Location
    Auckland, New Zealand.
    Posts
    820

    Default

    Hoop
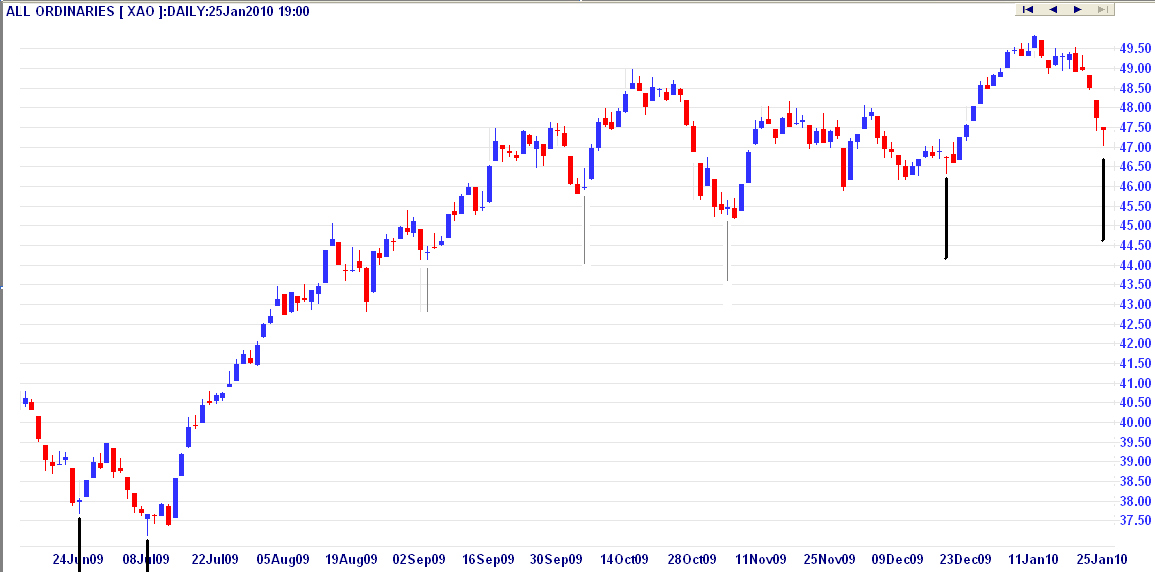
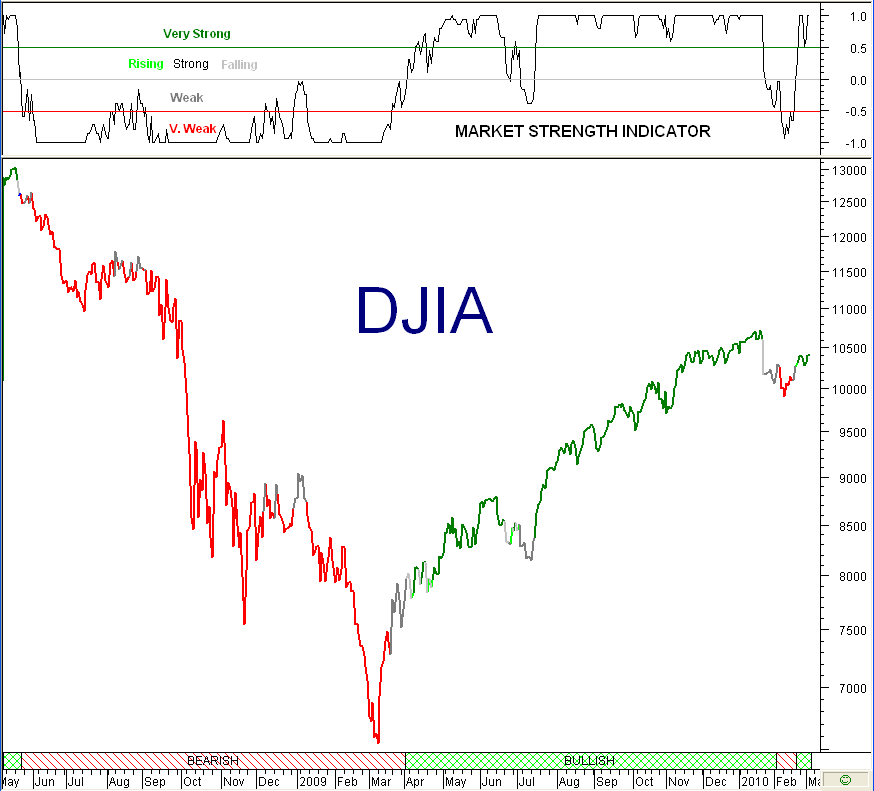
    Where would a bull market correction take the DOW 9500?
    what affect will that have on the asx i wonder.

    markets are starting to diverge vs the 2008-09 correlation.

    Phaedrus is calling aussie to bounce and he might be right with a solid reporitn season abotu to start...but it will be had for aussie if the SP and DOW are correcting

    btw, what % are you invested at the mo hoop?
    “If you're worried about falling off the bike, you’d never get on.”

  2. #582
    Advanced Member
    Join Date
    Dec 2001
    Location
    New Zealand.
    Posts
    1,936

    Default This is NOT a "Call"!

    Quote Originally Posted by Footsie View Post
    Phaedrus is calling aussie to bounce
    No he's not. He simply drew attention to Mondays candlestick. This chart shows some previous examples :-


  3. #583
    special needs
    Join Date
    Aug 2009
    Posts
    1,122

    Default

    nikkei down .11% anything to make of that?

    and hang seng .38%
    Last edited by evilroyrule; 27-01-2010 at 08:55 PM.

  4. #584
    Speedy Az winner69's Avatar
    Join Date
    Jun 2001
    Location
    , , .
    Posts
    37,884

    Default

    Just how rooted the US is relative to the rest of the world can be seen in this chart from chartoftheday.com

    Yanks need heaps more gold to buy the DOW now than they did a few years ago .... and note the log scale as well

  5. #585
    special needs
    Join Date
    Aug 2009
    Posts
    1,122

    Default

    hang seng on fire tonight, nikkei less so. cld it be 3 green for the DOW?

  6. #586
    Guru Dr_Who's Avatar
    Join Date
    Aug 2007
    Posts
    3,045

    Default

    China IS BOOMING! Up 2.4%
    Having got ourselves into a debt-induced economic crisis, the only permanent way out is to reduce the debt – either directly by abolishing large slabs of it, or indirectly by inflating it away.

  7. #587
    Advanced Member
    Join Date
    Dec 2001
    Location
    New Zealand.
    Posts
    1,936

    Default


  8. #588
    Guru
    Join Date
    Apr 2007
    Location
    Hamilton New Zealand.
    Posts
    4,251

    Default The Yellow Worry Zone

    Final confirmation that the Bull market correction is over.
    DOW had a good day and closed at 10889 (up 103 +0.95%)

    OK... what happens now..?
    If I knew I would be richer than Buffet.

    Well being a TA bent investor I would first have a look at the charts ...I would take history and project it forward look forward and use TA Targeting to find the next bull market correction due point.

    Using TA targeting method and simply averaging the 2 previous corrections uptrend distance at 2500 points the next correction due point should be in the vicinity of the 12300 area (2500 + 9835).
    Looking at the charts below from history there is confidence that a correction will start near or at a major resistance level. At the 12300 area unfortunately a major resistance point is absent...so one has to look at resistance points nearby. There are some around the 11760 area and more towards the 13000 area. Looking at the second chart I have marked this 11750-13000 zone in yellow. A wide area but the correction due point of 12300 happens to be nearly in the middle of this zone.


    The chart below points to some possible pessimistic news if one believes in charts.

    This next correction has to be taken seriously as it may or may be not a cyclic turning point. The 11760 level happens to be the peak back in February 2000 that saw the commencement of a cyclic bear market as well as a change of secular cycle from bull to bear. Investors will be reminded that in secular bear cycles (on average, give or take) cyclic peaks tend to be no higher than the last. However a long strong cyclic bull market during 2003-2007 did push a new high peak to over 14000...so hopefully this time around with this present day cyclic bull market we are in, we may see that 14000 area again.. but any level above 13000 if we get that far, would become a constant worry for the chartist investor.

    Now seeing that yellow zone within striking distance (10-20%) now, it may look as if the bear is ready to attack this year and the cyclic bull dies ...however correction due points are based on distance not time.

    I have illustrated this example, (see the red elliptical) February 1994 to February 1996.
    By Feb 1994 it seemed the cyclical Bull market had nearly run its course but as it happened it was still another 2 years before that due point was finally reached...this gave the market time to create a strong floor (support level) to spring up from and the life of the cyclic bull market was extended. EDIT: Its this same strong then Support / now(was) Resistance level (10700) that was broken up through last week...a very bullish sign.

    Last edited by Hoop; 24-03-2010 at 02:15 PM.

  9. #589
    Speedy Az winner69's Avatar
    Join Date
    Jun 2001
    Location
    , , .
    Posts
    37,884

    Default

    Hoop

    You might be interested in this view of the US markets .... even uses your Shiller figure

    http://hussmanfunds.com/rsi/valuatio...rdearnings.htm

  10. #590
    Speedy Az winner69's Avatar
    Join Date
    Jun 2001
    Location
    , , .
    Posts
    37,884

    Default

    Interesting piece
    http://www.investorsinsight.com/blog...-in-store.aspx

    The current - "buy-and-hold" investors in the S&P 500 Index are still 25.5% down from the levels of 10 years ago, the Dow Jones Industrial Index a similar 23.5% lower and the Nasdaq Composite Index a massive 52.5% under water.

    The future - Based on the above research findings, with the S&P 500 Index's current ten-year normalized PE of 20.3 and ten-year normalized dividend yield of 2.1%, investors should be aware of the fact that the market is by historical standards expensive. As far as the market in general is concerned, this argues for unexciting long-term returns, possibly a "muddle-through" trading range for quite a number of years to come.

    So buy and hold strategy appears next to useless .... need to be invested on the uptrends and out of the market on the downtrends ........ hey isn't that Phaedrus is trying to tell us

Bookmarks

Posting Permissions

  • You may not post new threads
  • You may not post replies
  • You may not post attachments
  • You may not edit your posts
  •