-
21-09-2010, 07:56 AM
#631

Jeez I was expecting to see the DOW down overnight...but BANG 160+points
-
25-09-2010, 07:51 AM
#632
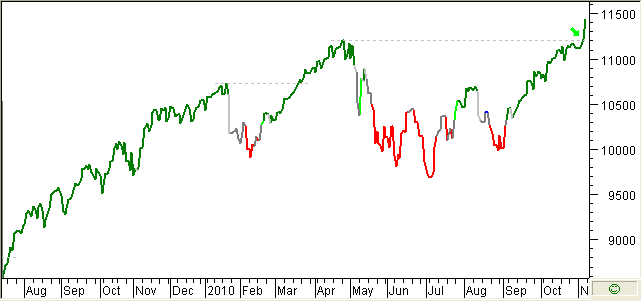
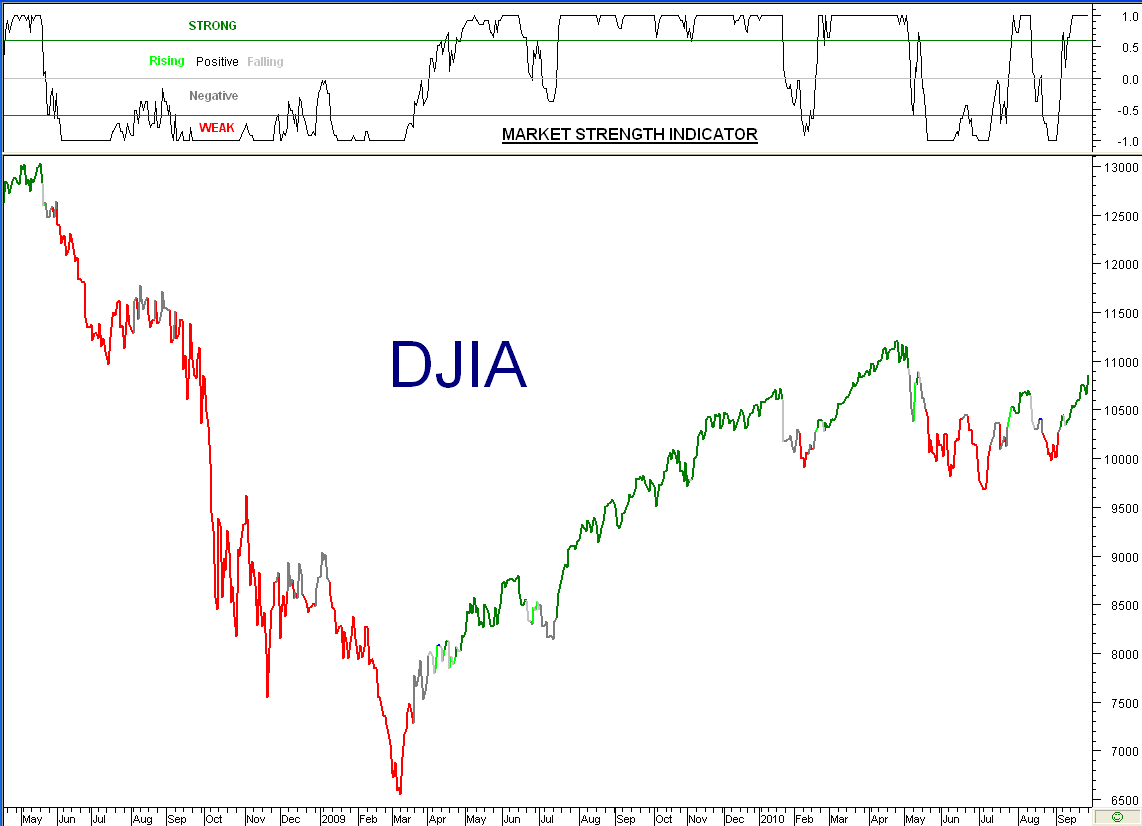
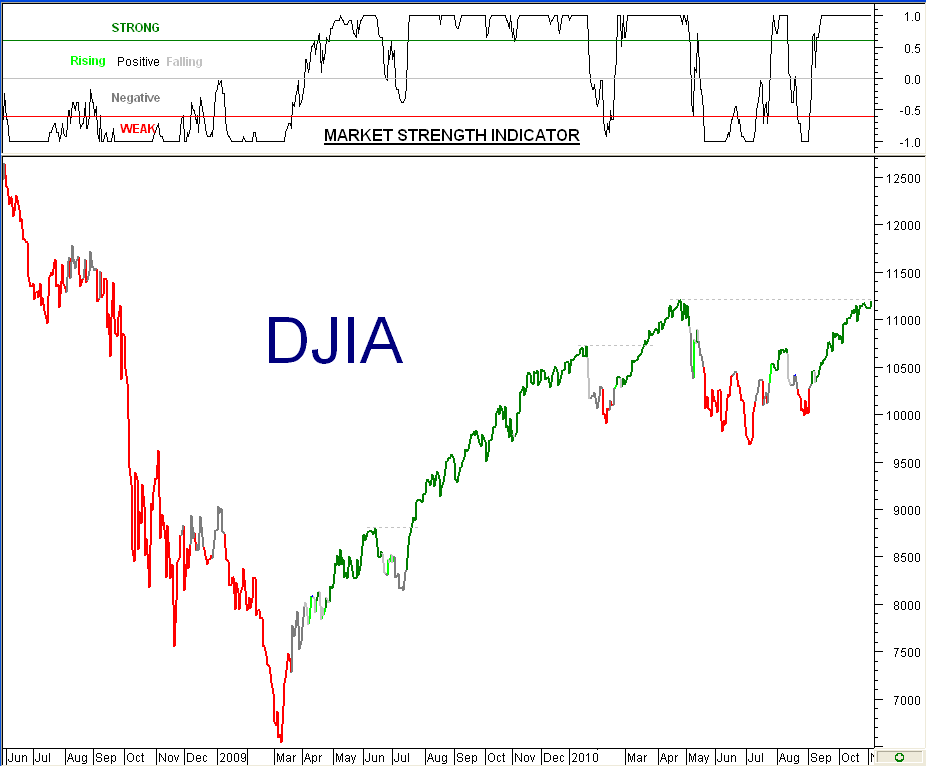
Chart Update
-
25-09-2010, 12:45 PM
#633
-
25-09-2010, 01:02 PM
#634
 Originally Posted by Corporate

hey P...i can't see it?
I can see it ok!
Dark green....can't get any stronger.
-
03-11-2010, 07:36 AM
#635
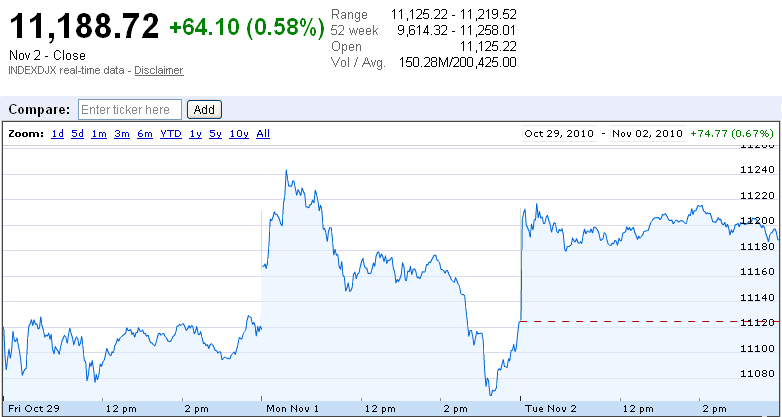
This 11,200 level on the Dow seems to be pretty significant, as we've seen the market fail around there numerous times on a daily and intra-day basis.
Am interested in TA as to probability of this breaking up or down? I am presuming any move is like to be quite strong once the magnetic pull of 11,200 is broken?
-
03-11-2010, 10:01 AM
#636
-
03-11-2010, 01:33 PM
#637
-
03-11-2010, 02:36 PM
#638
Thanks Phaedrus and Hoop. Yes, I am very "general" in my use of 11,200 as a level - just a visual squiz at the chart when I open my eyes most mornings and surprised at how many times it has hovered around/above this level before retreating back down.
Thanks, as ever, for the comments, charts and thoughts.
-
05-11-2010, 10:11 AM
#639
Originally Posted by Phaedrus
In my opinion, there is a high probability that the Dow will break "up".
There - that didn't take long did it!
-
05-11-2010, 10:40 AM
#640
Originally Posted by Phaedrus
There - that didn't take long did it!
Nope..and painless as well
 Posting Permissions
- You may not post new threads
- You may not post replies
- You may not post attachments
- You may not edit your posts
-
Forum Rules
|
|


 Reply With Quote


Bookmarks