-
31-10-2010, 09:56 PM
#141

Is this going to become a self fulfilling prophesy?
-
31-10-2010, 10:54 PM
#142
 More Good News - This twaddle doesn't apply to us! More Good News - This twaddle doesn't apply to us!
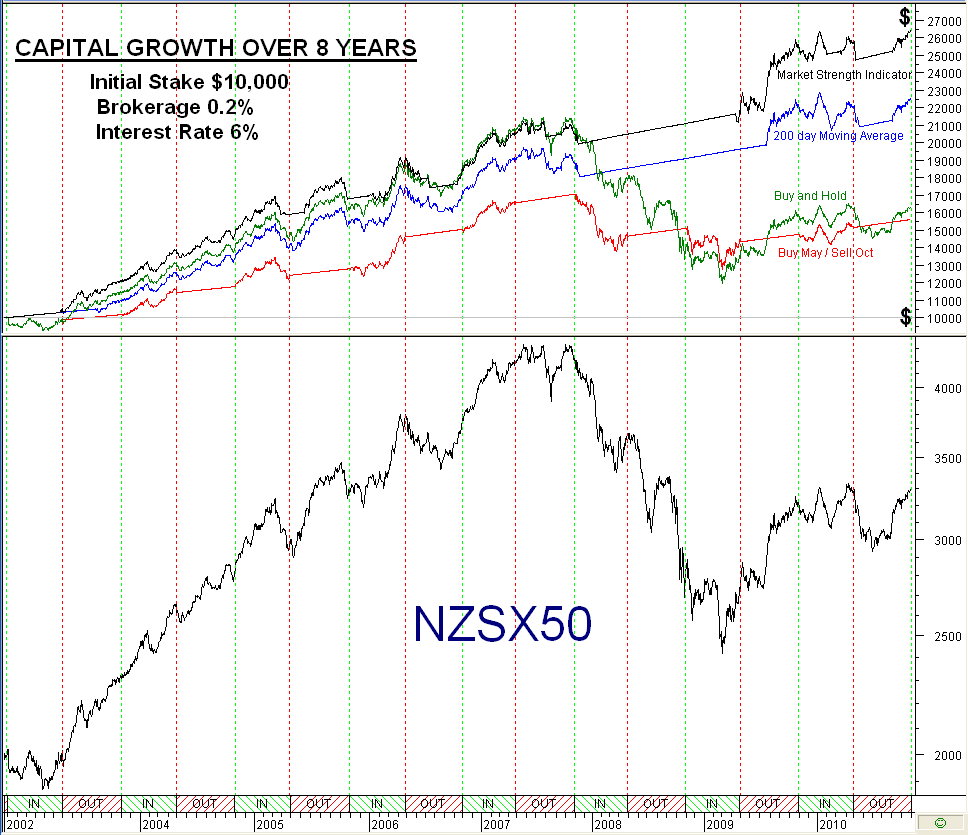
I don't have NZSX50 data going back as far as 1693, but here is a study of the 8 year period covered in this thread.
The chart below compares the capital gains accrued by the "May/October" system with (i) doing nothing (Buy and Hold), (ii) the usual 200 day Moving average and (iii) trading the Market Strength Indicator as discussed in the NZSX50 thread.

-
01-11-2010, 12:42 PM
#143
Junior Member


In any case, surely once you incorporate trading costs the case to try and time the markets becomes less compelling? Plus that way you don't feel like a sheep.
-
01-11-2010, 01:12 PM
#144
Member


 Originally Posted by Phaedrus

I don't have NZSX50 data going back as far as 1693, but here is a study of the 8 year period covered in this thread.
Of course your not going to get above average returns, when the period you cover is explicitly mentioned as not producing above average results.
there are some noteworthy periods during which the Halloween indicator didn't produce (e.g. during the oil embargo of 1973-74, the dot-com bust of 2000-01, and the financial meltdown of 2007-2009), the overall out performance is compelling.
-
01-11-2010, 06:15 PM
#145

 Originally Posted by JayPe

Surely once you incorporate trading costs the case to try and time the markets becomes less compelling?
Brokerage of 0.2% on 8 - 12 trades spread over 8 years is a trifling sum, but nevertheless it has been incorporated into the above chart. The 2 trading systems plotted there doubled and tripled the returns gained by simply buying and holding. I can't conceive of a more compelling example of the case FOR trying to time the market!
 Originally Posted by JayPe

... Plus that way you don't feel like a sheep.
Generally speaking, I think you will find that it is the sheeple that "buy and hold" regardless of overall market direction. They have been told that "it's time in the market that counts, not timing the market" - and unfortunately they believe it. They don't know how to time the market and think that it is impossible anyhow.
The aim is to make money, JayPe. Don't let your feelings get in the way of that.
-
01-11-2010, 06:32 PM
#146

Does your chart include
cost of trading software?
cost of data?
33% capital gains tax on any profits?
Dividends which the buy and holders would of recieved?
Time spent monitoring investments?
Is eight years really a long term chart?
-
01-11-2010, 07:01 PM
#147

Ratkin, that chart was set up to evaluate the worth of the "Halloween" TRADING SYSTEM and to compare its results with those of other approaches. It wasn't as good as "buying and holding" but plenty of systems are way, way better.
-
01-11-2010, 07:34 PM
#148

Quote "there are some noteworthy periods during which the Halloween indicator didn't produce (e.g. during the oil embargo of 1973-74, the dot-com bust of 2000-01, and the financial meltdown of 2007-2009), the overall out performance is compelling" In short, they are saying that the Halloween indicator worked really well - except when it didn't!
 Originally Posted by mr.needs

Of course your not going to get above average returns, when the period you cover is explicitly mentioned as not producing above average results.
But, Mr Needs, the Halloween indicator never produced above average returns. Right from the get-go it lagged well behind the market average returns of simply buying and holding. Take another look at the red plot in the chart. Well before the meltdown, it had only made about half the gains of simply buying and holding - and those guys talk about "compelling overall out performance"!!!
-
01-11-2010, 07:44 PM
#149

Halloween Indicator:
One popular system many people discuss is the “Sell in May and Go Away” (also known as the Halloween Indicator) strategy. The system simply invests in the stock market from November – April, then moves to cash from May – October. This strategy popularized by Yale Hirsh (who writes the informative and entertaining Stock Trader’s Almanac 2011), has its origins in the U.K. market as far back as 1935 (see must read paper “Are Monthly Seasonals Real?“).
The paper finds very strong evidence of abnormal performance in the UK since the 1600s, and Bouman and Jacobson (2002) find that the strategy works in 36 of the 37 countries they tested.
-
02-11-2010, 11:35 AM
#150
 Sell in May and........ lose money! Sell in May and........ lose money!
When we look back over the history of the NZSX50 Index, Q3 (July/August/September) is way ahead of the other 3 quarters. This explains the abysmal performance of the "Halloween" indicator (Buy in November, Sell in May) - it has you out of the market over its most profitable quarter.
As applied to NZ stocks, this "indicator" is devoid of meaning and totally worthless. It may have worked well hundreds of years ago in the UK and perhaps it still works well in the Northern hemisphere - but down here in NZ, over the period covered by the NZSX50 Index, it has been a resounding failure.
 Posting Permissions
- You may not post new threads
- You may not post replies
- You may not post attachments
- You may not edit your posts
-
Forum Rules
|
|

Bookmarks