-
02-11-2010, 12:45 PM
#151

 Originally Posted by Phaedrus

When we look back over the history of the NZSX50 Index, Q3 (July/August/September) is way ahead of the other 3 quarters. This explains the abysmal performance of the "Halloween" indicator (Buy in November, Sell in May) - it has you out of the market over its most profitable quarter.
As applied to NZ stocks, this "indicator" is devoid of meaning and totally worthless. It may have worked well hundreds of years ago in the UK and perhaps it still works well in the Northern hemisphere - but down here in NZ, over the period covered by the NZSX50 Index, it has been a resounding failure.
Maybe you just need to invert it to account for our position in the Southern hemisphere? NZ market is very sleepy in January.
-
02-11-2010, 01:07 PM
#152
Headline :- "Study backs up hallowed traders' whim"
It surely does - but the facts refute both the study and the theory it purports to evaluate.
Jacobsen and Zhang "looked at monthly data from the UK stock exchange to look at seasonal influences on share prices, and found that prices do tend to rise in November and fall from May.......... data from this country suggested the New Zealand market had been following the same trend since 1998".
Since the seasons are reversed here, if NZ was following the original hypothesis of seasonal influence, then it could not be expected to be "following the same (monthly) trend" as well and the Halloween indicator "rules" would not be applicable here.
When testing the "Halloween" indicator, I began to realise that paying a reasonable rate of interest whenever money was out of the market tended to obscure the true performance of the indicator in question. Losses incurred by a poor indicator that happened to be out of the market for extended periods of time tended to be obscured by the addition of significant sums of compounding interest dragging it up to an almost acceptable level of return. Time spent out of the market was not evaluated and so there were no repercussions if the indicator "got it wrong" by being out of a rising market.
A better way of evaluating systems is to sell and go Short on any sell signals. This has the effect of magnifying the inherent strengths and weaknesses that are part of every system. You are in the market (either Short or Long) at all times - get it wrong and you are punished. There is no 6% compensation to hide your mistakes and make lousy systems appear better than they really are. The chart below shows the combined financial results of trading the market from both long and short sides. The "Halloween" system gives a net loss over the 8 year "investment" period charted here. You think that drops the boot into it? Wait till you hear this! Acting contrary to "Halloween Indicator" signals by going long in May and Short in November made no difference at all! The result was a loss of much the same magnitude. Completely inverting this "indicator" changes..... nothing!!!
The conclusion is inescapable - in NZ, over the period covered by the NZSX50 Index, the Halloween indicator has proved to be worse than useless and totally devoid of meaning.
So, is there any merit at all in systems of this type?
Yes there is - take a look at the chart below.
-
04-11-2010, 11:53 AM
#153
Thanks Phaedrus in correcting the Halloween post I posted.. I didn't follow up and check the NZX50 part..Another example that we should not trust the media..after telling everyone not to on ST I go and do it myself  Too quick to believe as I find the Social Science Research Network as a valuable source of information, I failed to check the research paper out myself and trusted the writings from this Journalist GREG NINNESS from the Sunday Star Times instead. Too quick to believe as I find the Social Science Research Network as a valuable source of information, I failed to check the research paper out myself and trusted the writings from this Journalist GREG NINNESS from the Sunday Star Times instead.
Jacobsen and Zhang have published their findings on the Social Science Research Network This is the link http://papers.ssrn.com/sol3/papers.cfm?abstract_id=1697861
Click on the one click download at the top of the webpage
I haven't time to read it today but I briefly skimmed over it and Nowhere could I see any reference to the NZX.
Back to today NZSX50 - Good News ..the market index is currently at 3332 trading as high as 3337.5 which was above the closing day high of 3335.5 back in April 14 2010 which happened to be the highest closing day point since the March 2009 bottom.
The highest intraday high since the March 2009 bottom was 3348.7 recorded on the next day the 15 April.
Last edited by Hoop; 04-11-2010 at 11:59 AM.
-
11-11-2010, 10:46 PM
#154
Junior Member

Still Good News?
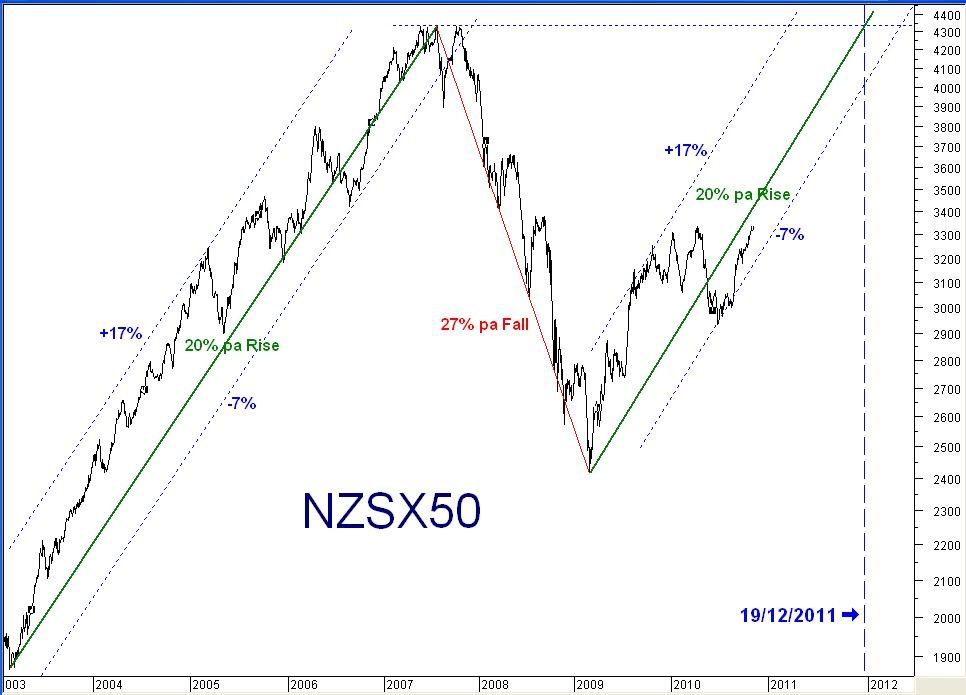
Phaedrus, it looks to me like we're still just tracking above the -7% line. Can you confirm or deny please?
Cheers, Roger
-
12-11-2010, 08:06 AM
#155
Chart Update
Fear not, Roger.
The Index is still nicely on track, well within its prescribed parameters and less than 3% away from the centreline.
-
18-11-2010, 08:51 PM
#156
Junior Member
Thanks for that Phaedrus. It's looking better than I thought. Pity it's not my shares that are doing the improving...
-
01-12-2010, 12:58 PM
#157
TA interest
Relationship between Directional movement indicator and the NZX50 trend and R&S lines
I used the weekly rather than daily to filter out the noise.
Its been a rather useful correlation during the recovery phase from the March 2009 bottom.
Of special interest is the latest DM sell signal which suprisingly has not been confirmed (yet?). ..so all eyes is on that 3220 weekly support level.
Another player is the bullish squeezing of the primary uptrend line against the 3320 weekly primary resistance line. The NZX50 has failed 3 times to break it and with the present -ve DM it will have to go +ve before the index has another attempt, which if the correlation is still true may take a little while yet.

-
18-12-2010, 02:17 PM
#158
the most recent posts on the SKT thread by Hoop and I probably belong on this thread ... I don't know how to quote across threads.
http://www.sharetrader.co.nz/showthr...l=1#post330493
-
19-12-2010, 08:15 AM
#159
Originally Posted by whirly
Is this sell off something that normally happens at year end as overseas funds take their money out pre Christmas so they dont get caught post Christmas trying to exit on low liquidity as everyone in NZ is at the beach?
It could be a good signal for January, as those funds buy back in having confirmed that the world hasn't collapsed over the new year.
-
19-12-2010, 09:38 AM
#160
CJ, take a long, hard, careful look at the chart in post #182. The answers to your questions are right there.
 Posting Permissions
- You may not post new threads
- You may not post replies
- You may not post attachments
- You may not edit your posts
-
Forum Rules
|
|


 Reply With Quote


Bookmarks