-
19-12-2010, 11:14 AM
#161

 Originally Posted by Phaedrus

CJ, take a long, hard, careful look at the chart in post #182. The answers to your questions are right there.
Hmmmm that interesting P
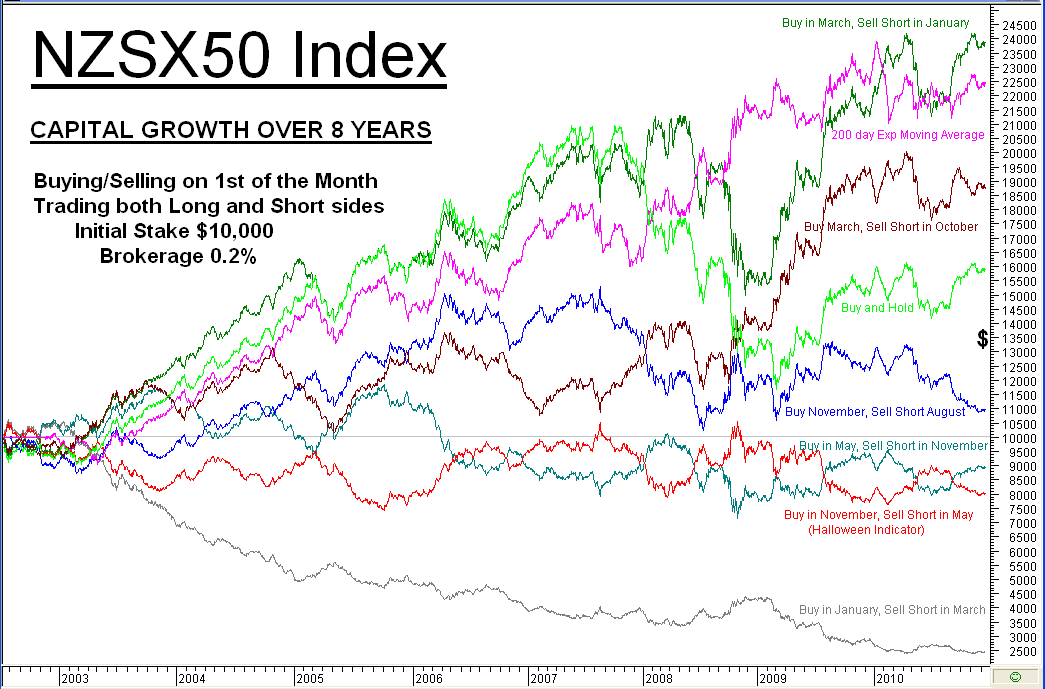
I notice on your chart182 that there isn't a never sell line but I guess it would end around the $16500 mark is that correct P?.
If that's the case then buy the NZ50 index on 1 Jan and sell 1 March must be a shocking loss scenario...I know its never that great to invest around the summer holiday time but is the odds really that bad?? It would be interesting to see if its not too much trouble for you Phaedrus.
Last edited by Hoop; 19-12-2010 at 11:16 AM.
-
19-12-2010, 11:25 AM
#162
INteresting, I remember from ages ago something about the 'janurary effect'. Cant remember if it applied to NZ but I think there were good gains in Janurary in most years. That would suggest that sell at the end of Janurary makes sense to lock in that increase.
If that is the case (I am not good at reading charts) what is the cause. Is if funds buying up in Jan and having to overpay to get the shares they want. ONce they have their positions, there is a lack of buyers hence stay out in Feb as prices easy off. ????
-
19-12-2010, 11:58 AM
#163
Is this sell off something that normally happens at year end as overseas funds take their money out pre Christmas so they dont get caught post Christmas trying to exit on low liquidity as everyone in NZ is at the beach?
CJ, take a long, hard, careful look at the chart in post #182. The answers to your questions are right there.
I guess the answer to CJ's hypothesis is no then. I have had a look at my own charts and can't find any confirmation of a change in trend based on this obv drop.
-
19-12-2010, 04:51 PM
#164
Originally Posted by Hoop
I notice on your chart (#182) that there isn't a "never sell" line.....
I have now added a "Buy and Hold" plot just for you, Hoop. It's not so hot is it? Of course we both already knew that would be the case!
Originally Posted by Hoop
Buy the NZ50 Index on 1 Jan and sell 1 March must be a shocking loss scenario...I know its never that great to invest around the summer holiday time but are the odds really that bad?
It is pretty bad. As the "opposite" of the most profitable monthly timing strategy, it had to be the worst, of course. Is the actual loss really that bad? No, not really. Do keep in mind here that this test involved going Short whenever you were not long so that the comparative efficacy of each of these options was enhanced (ie exaggerated). So, for that worst example, you were Short the Index for 10 months of every year. Of course, by going long only, a modest profit would have been made over the 8 years of the test. The actual profit is $762 - that's from investing $10,000 for 8 years. Gains don't come much more modest than that!!
-
20-12-2010, 09:02 AM
#165
Originally Posted by belgarion
Now that everyone knows ... The 3rd Jan 2011 will be a shocker!
Don't panic Belg ..the NZSX50 - Good News is you're safe, the NZX is closed on the 3rd
NZX Trading hours
EDIT: thxs P
Last edited by Hoop; 20-12-2010 at 09:18 AM.
-
20-12-2010, 12:14 PM
#166
I see PRC leaving the index at zero looks to have knocked another 18 points off it. Back to hugging the bottom trend line? Going to be hard to stay in P's magic range if the market goes down between Jan and March. Better have a decent rally before 31st Dec! 
-
09-01-2011, 03:46 PM
#167
Originally Posted by belgarion
We seem to be at significant resistance level being around 3,333 which was hit in Jan 2010, April 2010, Nov 2010 and now Jan 2011.
This time a breakout? Or is it time to take my toys home for a bit?
Looking at Phaedrus's graph, we appear to be right on at the bottom 7% variance line at this time. So if Phaedrus's tongue in cheek prediction is to continue then the odds favour a breakout.
Given the current macros and the fear pervading in Jan, Apr, Nov that seem absence now, a breakout also looks possible.
Looking back between 2004 when the NZ50 started and the middle of 2007 when the GFC loomed, just one year, 2005, showed a significant NY dip that (as usual?) didn't begin until med-Feb. Mid-Feb is when many companies report either HY or FY so its a good time to take (or drop) stock. Thus recent history would suggest hanging on would be a good thing at this juncture.
The next week, now the big boys are back, should be interesting. Mid-Feb will be where the fun (or carnage) begins.
Hi Belg ...I expect there is a good chance of that very strong resistance 3333 level will be broken shortly...This could be a rounded bottom in progress and a break out above the 3333 will confirm it
Rounded bottoms during a bull market can occur after a very good rise up and the market then takes an extended lengthy breather (catch up) before rising again. The breather could be months or a year or so, therefore using a long term period and weekly scale tends to show up these type of formations much better than using a daily scale chart which could produce "noise" and mask the formation. However this time around the NZX50 rounded bottom is easily seen on a daily scale chart.
I have added a weekly scale chart below which so far shows the possible rounded bottom formation, and it seems to fit the criteria that Bulkowski mentions...it has an additional right hand handle forming as well which is nice as it shows the distinct end of the rounded bottom formation, so we don't have to guess the end rim and it adds confirmation that we do indeed have a rounded bottom formation.
The breakout of this formation occurs at the distinct end of the right hand lip (rim) or in this case where the handle is which just happens to coincide with that long term 3333 resistance level.
If the NZX50 index breaks upward above the right hand handle (and above 3333) the target until the next correction is approximately 3710. This is spookly close to the 3700 (3680) resistance level.
The chance of failure after an upward break is low (5%)
Note not on chart ...the next small long term resistance level (3400) above the right hand rim/handle should be made aware of as a slight potential threat....I didn't think it was worth putting on the chart
Target price = lip + (lip - lowest point of the rounded bottom) ....... Target Price 3710 = 3330 + (3330 - 2950) There is a 57% chance on meeting this 3710 target price (Bulkowski)
So now we will wait and see what happens..eh

Last edited by Hoop; 09-01-2011 at 03:57 PM.
-
09-01-2011, 05:48 PM
#168
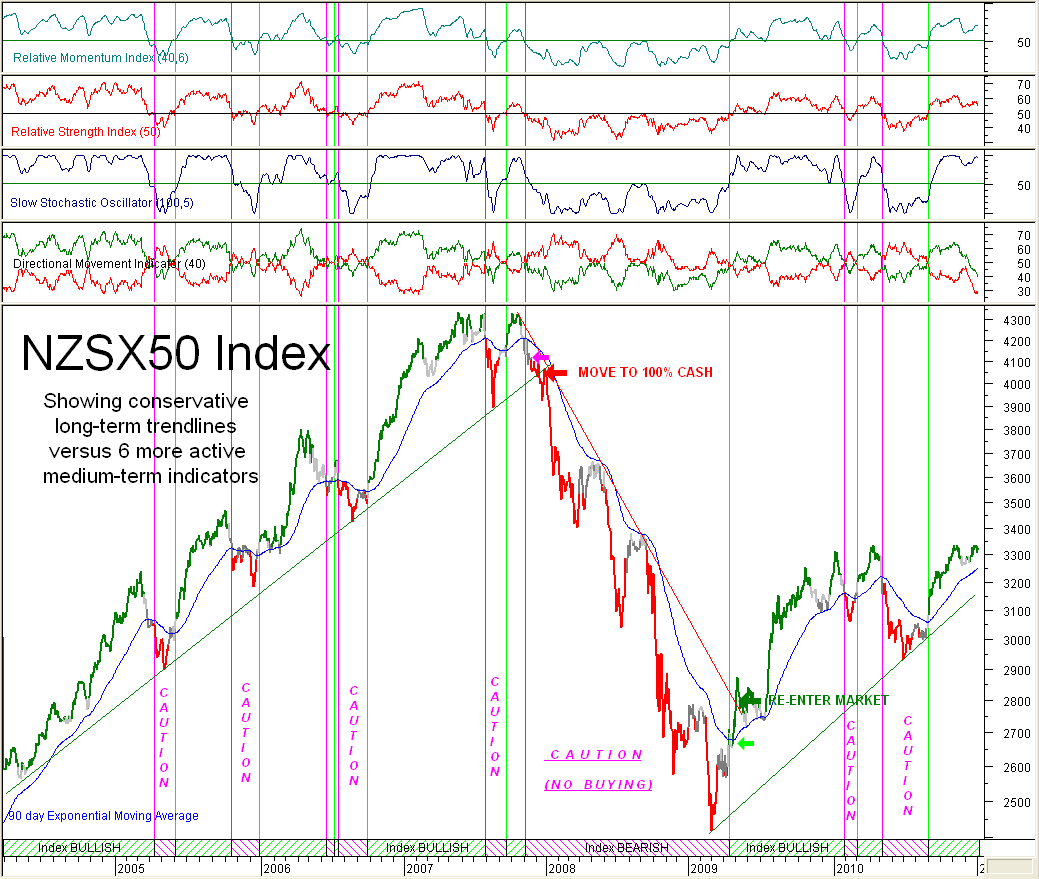
NZSX50 Chart with multiple "Medium-term" indicators.
Here is a chart that compares signals from 6 separate indicators :-
Relative Momentum Index
Relative Strength Index
Slow Stochastic Oscillator
Directional Movement Indicator
Exponential Moving Average
Market Strength Indicator.
In spite of their very different formulae, these indicators have been giving virtually identical signals.
Why use such "medium-term" indicators at all? Because they give good early warning of any incipient weakness developing, getting you out of the market earlier than long-term indicators when the market weakens, and getting you back in again earlier than long-term indicators.
It is easy to see that none are anywhere near indicating a need for caution.
In the immortal words of Alfred E. Newman, What? me worry???
-
09-01-2011, 06:15 PM
#169
phaedrus,
Happy new year to you.Thank you for the chart and your comments.
Feel a lot more at ease with Alfred E.Newman's sage advice.! Thank you.
-
14-01-2011, 08:07 AM
#170
50% Fib is 3377 ...... hey we are half way back to high of a few years ago
Will Natures forces relent and get us through this barrier ... all good news if it does .... but Nature seems to be pretty angry at the moment so we might have to wait a while
 Posting Permissions
- You may not post new threads
- You may not post replies
- You may not post attachments
- You may not edit your posts
-
Forum Rules
|
|


 Reply With Quote

Bookmarks