-
06-11-2009, 07:31 AM
#101

http://invetrics.com : Financial Insight and Market Timing Signals -data point 05 November 2009- (may adjust at Market Open)
The Technical SPX 500 Whereabouts -data point 04 October 2009-
http://stocktiming.com : Technical Market Analysis -data point 04 November 2009-
 ...Institutional Core Holdings
 ...Institutional NET Buying and Selling Volume levels
 ...Long Term Trending Fed. Liquidity and Foreign Liquidity Inflows
 ...NYSE Momentum and Strength
US Economic Calendar -data point 05 November 2009-
>US Productivity-Prel Q3: actual 9.5%(forecast 6.4%) (consensus 6.5%) (prior 6.6%)
>US Initial Claims 10/31: actual 512K (forecast 525K) (consensus 525K) (prior 530K)
>US Continuing Claims 10/24: actual 5749K (forecast 5730K) (consensus 5750K) (prior 5797K)
Stock Market Day Trader update -data point 05 November 2009-
...everthing sweet and the SPX continues its rally from Mon *1029 Low as epected but -upticks remain corrective- as the Trin dodgedly refused to move out of neutral into bullish territory throughout the session for now; on the other hand, uptick buying power is apparent and daily New Highs are slowly building -someone is either buying carefully without driving the market into a frenzy or institutions are carefully allowing the retail investor to drive the market higher and stealhlike selling into the rally- take a look at today's volume divergence
...as a consequence, the current advance could still be part of an oversold corrective bounce to challenge the Oct 29 High *1067 or the Oct 22 Low *1074 or given the current momentum, the Oct 26 Congestion *1084 in the next 24 hours before topping out; please note that the test in the Core Holdings is still continuing as it appears that institutions wait for tomorrows unemployment data;
...failure near or below *1067/*1084 tomorrow should trigger a much more aggressive sell-off over the next few weeks with the Oct 02 Low *1020 as an initial target; taking out *1020 on a Close basis should accelerate losses toward the Jun High *956 initially with potential to retest the Jul Low *869 before year-end
...initiating a short position at *1084 -to cover downside risk on equity exposure for now- but if *1084 is taken out, the market most likely will take on the Oct 21 High *1101 with potential for a new recovery High target SPX 500 *1230
SPX 500 Hedge Study: -data point 05 November 2009-
...To Be or Not To Be LONG – CASH – SHORT
...the bounce in the SPX 500 over the last three days was characterized by contracting NYSE volume; holding a long position in the 'High Risk Zone'would have netted approx. 10 points (buy *1034/*1035) over the last three days was characterized by contracting NYSE volume; holding a long position in the 'High Risk Zone'would have netted approx. 10 points (buy *1034/*1035)
...market action turned south and closed below the 50-day MA and the primary March uptrend line to end the session on a bearish note; risk lingers, that the short term bounce could already have topped today; 'High Risk Zone' uncertainty
Market Commentary -data point 05 November 2009-
Eric Sprott & David Franklin: Surreality Check -Dead Government Walking- http://www.marketfolly.com/2009/11/d...edge-fund.html ...The equity market performance in November 2007 masked the underlying problems plaguing the financial system at the time, and it’s blindingly apparent that it is doing the same again today. The government has assumed most of the financial system’s liabilities in a giant game of ‘kick the can’. The calls for a new bull market are coming fast and furious. Market participants are bidding up the stocks of companies that are demonstrably bankrupt, and government balance sheets have ballooned to unforeseen levels. As respected market commentator David Rosenberg recently wrote, “the stock market is divorced from economic reality”.1 It’s time for another surreality check, but this time it isn’t the publicly traded companies that deserve attention, it’s the governments that have saved them. Make no mistake – the dead men are still walking – they’re just a lot bigger now than they were two years ago, and they don’t generate earnings – they print money and tax their citizens
David Rosenberg (Gluskin/Sheff): GOLD-ilocks https://ems.gluskinsheff.net/Article...ave_110509.pdf
...For the first time in a long time, we are thinking about that prospect described above — not that inflation is an immeditate threat but, at the margin, it could surprise us earlier rather than later. So, it may not be a bad idea to look at hedges from all sources — expanding the exposure to gold and commodities, and even TIPS and real return bonds that offer what gold does not — an income stream. Just a thought
Long Term: THE BEAR
_no guarantees and trading strategies are just ideas_
Kind Regards
Last edited by ananda77; 06-11-2009 at 09:38 AM.
-
07-11-2009, 08:03 AM
#102
-
09-11-2009, 10:45 AM
#103
Looks like 3 drives to a top, or H&S

___________________

___________________
-
09-11-2009, 03:48 PM
#104
Last edited by Hoop; 09-11-2009 at 03:56 PM.
-
09-11-2009, 07:44 PM
#105
http://invetrics.com : Financial Insight and Market Timing Signals -data point 09 November 2009- (may adjust at Market Open)
The Technical SPX 500 Whereabouts -data point 06 October 2009-
...unless the primary 2007/2008 bear line is taken out, the current bull advance remains unstable
http://stocktiming.com : Technical Market Analysis -data point 06 November 2009-
 ...Institutional Core Holdings
 ...Institutional NET Buying and Selling Volume levels  ...Long Term Trending Fed. Liquidity and Foreign Liquidity Inflows  ...NYSE Momentum and Strength
US Economic Calendar -data point 09 November 2009-
>actual-----(forecast) (consensus) (prior)
>actual-----(forecast) (consensus) (prior)
>actual-----(forecast) (consensus) (prior)
Stock Market Day Trader update -data point 09 November 2009-
...market internals show extreme bullish sentiment for the fourth trading hour now and as a result, the SPX 500 surged to intraday High *1087 and closed the hourly *1084 gap; after penetrating *1084; the index appears capable of testing the October 21 Peak *1101 with potential to surge to *1122 for a test of the 2007/2008 primary downtrend line
...bearing in mind the continuous bearish divergences in momentum, volume, and strength and the fact, the SPX 500 as well as the Nasdaq are lagging the advance behind the Dow for the first time since the March Low, it pays to remain cautious until the market resolves to the up-side, especially if hedged to protect equity exposure, as these facts could be warnings of a potential imminent reversal between *1101/*1122,
…failure below this range will drive the market to the October Low *1020 initially
SPX 500 Hedge Study: -data point 09 November 2009-
...To Be or Not To Be LONG – CASH – SHORT
Market Commentary -data point 09 November 2009-
Marc Faber: short term concerns about commodities, says gold may drop to US$800 http://www.bi-me.com/main.php?id=417...=62&cg=4&mset= ...“If you have the private sector withdrawing credit and the government throwing credit at the system you can get a lot of volatility,” Faber said, adding he would be careful to buy equities now as “we are in a correction period.”
Jim Rogers/Marc Faber: agree US dollar due for temporary rebound http://www.bi-me.com/main.php?id=415...cg=4&mset=1041 ...Speaking in an interview with Bloomberg television in Singapore, Rogers said: “Everybody is pessimistic on the dollar. Whenever you have everybody on the same side of the boat, you know what you have to do. We may have a rally in the dollar, a decline in commodity prices or stock prices for a while.”
Marc Faber: As of today, I will be long in dollars -data point 04 November 2009
Long Term: THE BEAR ......facing a monster ......facing a monster
_no guarantees and trading strategies are just ideas_
Kind Regards
Last edited by ananda77; 10-11-2009 at 07:42 AM.
-
10-11-2009, 08:39 AM
#106
Hoop quote..."1080 point to watch for establishment of possible H&S formation."
As I write the S&P500 is 1090 up 21. The S&P500 as broken through the 1080 resistance level.
..Arco's suggestion of a bearish H&S pattern forming is a goneburger.
-
10-11-2009, 08:49 AM
#107
Time to throw in the towel, we're going straight up forever.

-
10-11-2009, 12:15 PM
#108
...the NYSE Trin showed 0.28, indicating extreme bullish sentiment butvolume remains tepid for such an advance; however, if there is a large degree of consensus about market direction, advances are possible with no particular huge volume spikes;
...anyway, my equity investment will enjoy days like that but as far as the hedge is concerned, I need to see 'Follow Ttrough' on a Closing Basis tomorrow to wipe out the possibility of a one day wonder before I go 'cash' again
...after today's advance, the market will most likely power ahead to chew up the SPX 500 *1122 level (= 50% Fibonacci) but that level needs to be confirmed after a break-out before I consider another SPX 500 bullish advance to *1230 initially -its that simple-
Kind Regards
Last edited by ananda77; 10-11-2009 at 06:32 PM.
-
10-11-2009, 07:04 PM
#109
Last edited by ananda77; 11-11-2009 at 08:59 AM.
-
11-11-2009, 11:15 AM
#110
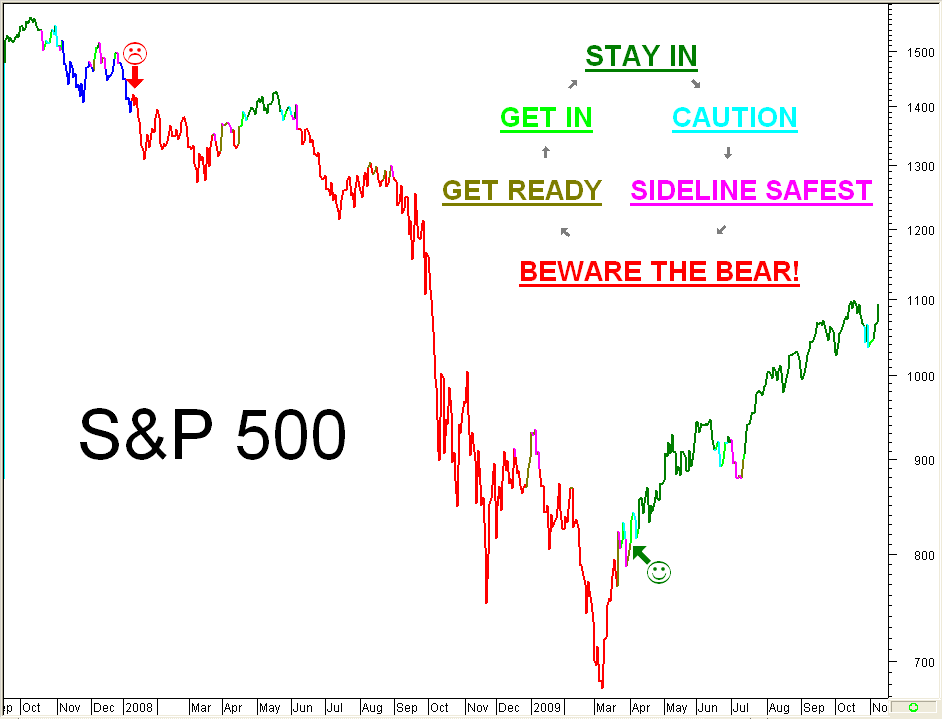
What to do?
Should you Buy, Hold, Sell, or move to Cash?
Confused by a plethora of arcane charts?
More can be less.
Here is a Market Overview for simple unsophisticated people like me :-
The uptrend continues.
Stay In.
Be careful.
 Posting Permissions
- You may not post new threads
- You may not post replies
- You may not post attachments
- You may not edit your posts
-
Forum Rules
|
|


 Reply With Quote
 declining steadily, an indication of selling into the rally and the current advance having the hallmark of a Counter Push to possibly test the *1084 gap -hourly- potential for *1101 test
 testing short term down trend line
  back below primary down trend line indicating positive short term market sentiment


 ...Institutional Core Holdings
  ...Institutional NET Buying and Selling Volume levels
  ...Long Term Trending Fed. Liquidity and Foreign Liquidity Inflows
  ...NYSE Momentum and Strength
 ...'short tilt' to *1084 initially;
 ...facing a monster
Bookmarks