-
10-12-2009, 07:52 PM
#151

 Originally Posted by arco

Still moving to plan on the Purple Track

rgds - arco
-Thanks Arco-
http://invetrics.com: Financial Insight and Market Timing Signals -data point 10 December 2009- (may adjust at Market Open)
The Technical SPX 500 Whereabouts -data point 09 December 2009-
[center] ...past upper bear line and below the 50% retracement ...past upper bear line and below the 50% retracement
http://stocktiming.com: Technical Market Analysis -data point 09 December 2009-
...Long Term Trending Fed. Liquidity and Foreign Liquidity Inflows -lower top indicating deeper negative implications if holding
...Institutional Buy/Sell Spread -low accumulation-
...Institutional Selling Action -selling trendlines negative upside crossover-
US Economic Calendar -data point 10 December 2009 -
>US Initial Claims 12/05 : actual---- (forecast 450K) (consensus 465K) (prior 457K)
>US Continuing Claims 12/04: actual---- (forecast 5475K) (consensus 5435K) (prior 5465K)
>US Trade Balance Oct: actual---- (forecast -35.0B) (consensus -37.0B) (prior -36.5B)
>US Treasury Budget Nov: actual---- (forecast -135.0B) (consensus -134.1B) (prior -176.4B)
Stock Market Day Trader update -data point 10 December 2009 -
SPX 500 Hedge Study: -data point 10 December 2009 - ...To Be or Not To Be LONG CASH SHORT-
... another low volume bearish day with subdued buying towards day end; the next down target is the 50-day MA *1078 and further down the gap from the Nov 6 Close *1069.3 and Nov 9 Open *1072.3
...although the index remains in an uptrend down to the Nov 2 Low *1030, trading below the 50-day MA to fill the gap would be 'yellow zone' for bullish sentiment
...considering the short time span to the Dec 30 quarter end option expiry, it would be essential for the bulls to hold *1071 for the long awaited test of the 50% retrace of the 2007/2009 Break *1122 and the September/October 2009 upper resistance line *1142 to go ahead before year end
...the SPX 500 Hedge chart:

> before market open: current position update: 'short tilt'
>after Market open current position update:
Market Commentary -data point 10 December 2009-
Long Term: THE BEAR
_no guarantees and trading strategies are just ideas_
Kind Regards
Last edited by ananda77; 11-12-2009 at 08:16 PM.
-
11-12-2009, 09:42 AM
#152
...connection problems tonight
...the x-mas rally in the SPX 500 appears now underway after the index successfully defended *1084
...next target is the 50% retracement of the 2007/2009 Break *1122 and further up, the September/October upper resistance line *1142 and further up, the BLOW-OFF Territory
Kind Regards
-
12-12-2009, 06:56 AM
#153
Originally Posted by arco
Still moving to plan on the Purple Track
rgds - arco
-Thanks Arco-
http://invetrics.com: Financial Insight and Market Timing Signals -data point 11 December 2009- (may adjust at Market Open)
The Technical SPX 500 Whereabouts -data point 10 December 2009-
[center]  ...past upper bear line and below the 50% retracement ...past upper bear line and below the 50% retracement
http://stocktiming.com: Technical Market Analysis -data point 10 December 2009-
.  ..Long Term Trending Fed. Liquidity and Foreign Liquidity Inflows -lower top indicating deeper negative implications if holding
 ...Institutional Buy/Sell Spread -low accumulation-
 ...Institutional Selling Action -selling trendlines negative upside crossover-
US Economic Calendar -data point 11 December 2009 -
>US Retail Sales Nov: actual 1.3% (forecast 1.0%) (consensus 0.6%) (prior 1.4%)
>US ex Auto Nov: actual 1.2% (forecast 0.2%) (consensus 0.4%) (prior 0.2%)
>US Mich Sentiment Prel Dec: actual 73.4 (forecast 69.7) (consensus 68.8) (prior 67.4)
>US Business Inventories Oct: actual 0.2% (forecast 0.2%) (consensus -0.2%) (prior -0.4%)
Stock Market Day Trader update -data point 11 December 2009 -
...the SPX 500 rally stalled below *1110 and may want to confirm the Dec Low *1099 as a short term support before heading higher again
...failure in that level would keep the index range bound but eventually a break-out one way or another is going to happen soon
SPX 500 Hedge Study: -data point 11 December 2009 - ...To Be or Not To Be LONG – CASH – SHORT-
...the SPX 500 breaking above range *1110 would be bullish and the market should surge higher at least to test *1122/*1145 (+)
...on the downside, breaking *1083 would be bearish indicating the market will go for the *900 level
...considering current divergences, the market could still be breaking down from current levels
...the SPX 500 Hedge chart:

> before market open: current position update: 'short tilt'

>after Market open current position update:unchanged
Market Commentary -data point 10 December 2009-
Merryl Lynch: Hedge Fund Exposure Levels: Still Very Long Equities http://www.marketfolly.com/2009/12/h...arket+Folly%29
SocGen: Focusing On (And Profiting From) The Upcoming Chinese Financial Crisis http://www.zerohedge.com/article/foc...nancial-crisis ...Mr. Grice's conclusion: buy if you must, but wait for the credit bubble pop. This in itself should be so self-evident, especially in light of last year's events, yet so many speculators are glued to the buy button that the Chinese implosion will certainly not end pretty...
Long Term: THE BEAR
_no guarantees and trading strategies are just ideas_
Kind Regards
-
14-12-2009, 08:22 PM
#154
Last edited by ananda77; 15-12-2009 at 08:06 AM.
-
15-12-2009, 12:13 PM
#155
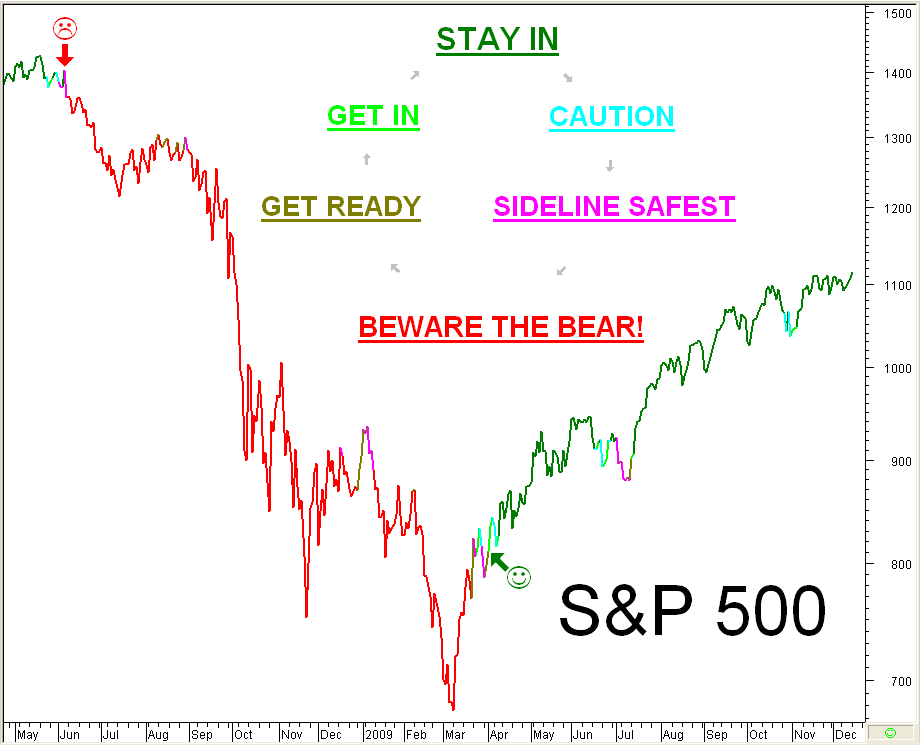
Stay In (New high!)
-
16-12-2009, 12:45 PM
#156
 And to YOU. THANK YOU. And to YOU. THANK YOU.
Originally Posted by ananda77;285816
...and that's it for me for 2009; it's been a good year; [b
- ALL THE BEST FOR 2010-[/b]
great consistent work. much appreciated.
Also thanks to Phaedrus for his beamer - in the chart.
Also to Hoop, arco and all who contributed here. Great work people. have a restful break.
-
20-12-2009, 09:42 PM
#157
Weekly Update. Still green.
-
04-01-2010, 09:54 AM
#158
2009 Final Update. Still Green!
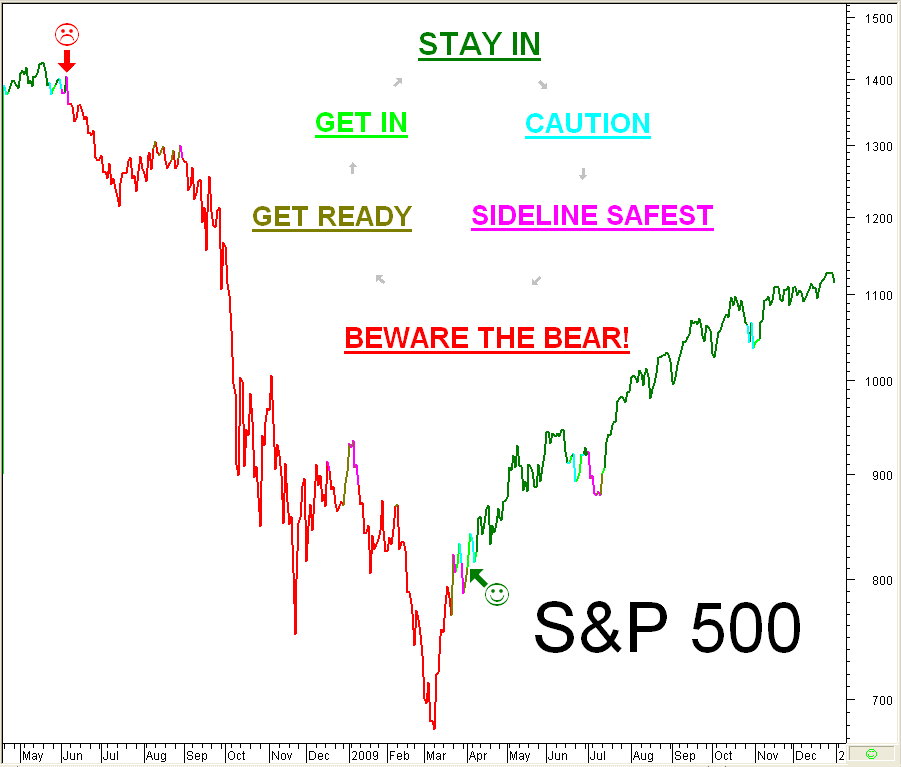
Aren't you glad you got in?
Aren't you glad you stayed in?
-
04-01-2010, 05:22 PM
#159
Not an Advertisement
I have posted this...NOT...because I endorse Mike Swanson's product, But there is a good historical look back at the markets and his thought on a sideways trend this year.
http://www.wallstreetwindow.com/repo...rketreport.pdf
So just look past the marketing and see where the year MIGHT go.
-
05-01-2010, 09:54 PM
#160
A SUCCESSFUL NEW YEAR TO YOU ALL
www.invetrics.com:
(may adjust at market Open)
www.stocktiming.com:
issues (30 - 50)% SPY/QQQQ 'buy' recommendation -data point 28 December 2009-
Trader Update -data point 04 January 2010:
...SPX 500 bullish opening of new trading year to new 15-month High *1134; NYSE market breadth 25:6 positive, Nasdaq 22:6 positive bodes well for further gains to test upper channel resistance *1145/*1150 near term; >*1170 anyone??<
...failure in that range would invite a corrective move back to the 50-day MA initially, with further possible downside to test August/September/October Lows trend line *1073
Long Term: THE BEAR
_no guarantees and trading strategies are just ideas_
Kind Regards
Last edited by ananda77; 06-01-2010 at 07:15 AM.
 Posting Permissions
- You may not post new threads
- You may not post replies
- You may not post attachments
- You may not edit your posts
-
Forum Rules
|
|


 Reply With Quote


 ..Long Term Trending Fed. Liquidity and Foreign Liquidity Inflows -lower top indicating deeper negative implications if holding
 ...Institutional Buy/Sell Spread -low accumulation-
 ...Institutional Selling Action -selling trendlines negative upside x-over loosing some steam-
 likely to test upper resistance 77 (+) in the near future; no economic data as well -a perfect Monday for a higher SPX 500-
 ), neutral tick buying power, and institutional buying muted above current trading range
 ...institutional selling action; now covered -Cash/ downside stops


Bookmarks