sharetrader
Page 24 of 191 FirstFirst ... 142021222324252627283474124 ... LastLast
Results 231 to 240 of 1906
  1. #231
    Senior Member ananda77's Avatar
    Join Date
    Jun 2004
    Location
    New Zealand.
    Posts
    1,465

    Default

    www.invetrics.com:- data point 08 February 2010

    (may adjust at market Open)

    www.stocktiming.com: -data point 08 February 2009-

    cash -data point 22 January 2010-

    Trader Update -data point 08 February 2010:

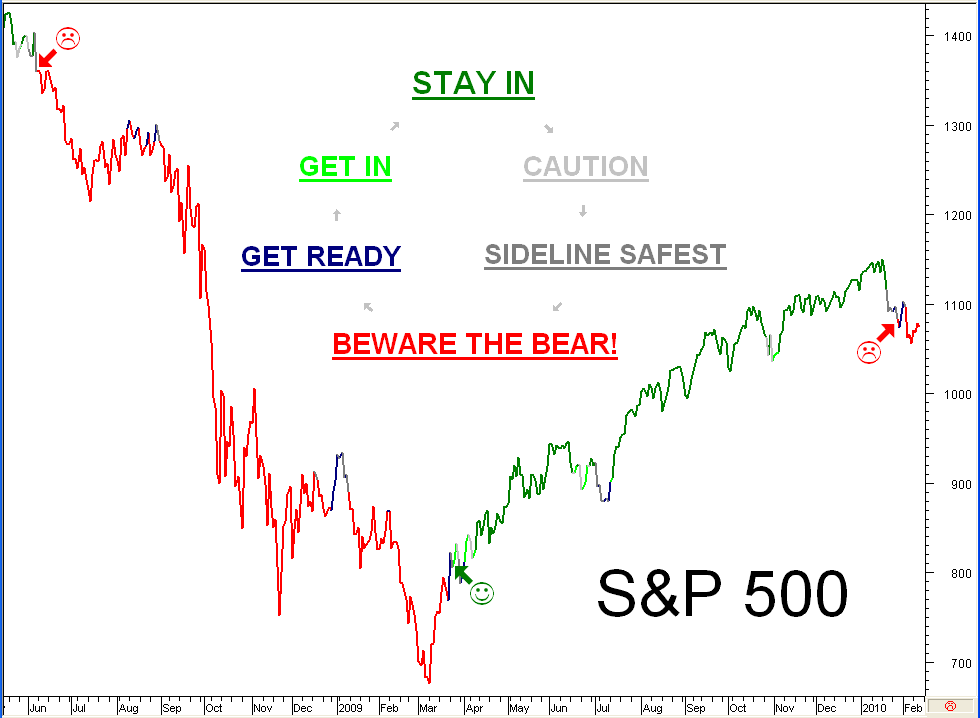
    ...the SPX 500 is extending a corrective bounce up that started Friday 5 in late trading and appears to be headed into the *1073/*1080 range short term; at the time of writing, the index has already reached an intraday High *1070 where some selling became apparent

    ...failure in that range would set a new down target in the *1030/*1017 range, the Oct/Nov 2009 Lows with potential to reach down to the Aug 17 Low *979

    Long Term: THE BEAR
    Last edited by ananda77; 09-02-2010 at 07:38 AM.

  2. #232
    Senior Member ananda77's Avatar
    Join Date
    Jun 2004
    Location
    New Zealand.
    Posts
    1,465

    Default

    ...quick update on the GO...

    *1073/*1080 appears to be firm resistance and the lower end of the range *1073 -if failing as support- would signal another sell-off is imminent; would not want to be in a long position below *1073 -more sometime later-

    Kind Regards

  3. #233
    Legend peat's Avatar
    Join Date
    Aug 2004
    Location
    Whanganui, New Zealand.
    Posts
    6,437

    Default

    a couple of days after the hammer and we get a morning star engulfing pattern, possibly the best sign of a turnaround yet. not that I'm overly bullish, its not a huge number of points.... but its perhaps a warning that the bounce may not have fully played out yet. (And that there may be better times to add more shorts)
    For clarity, nothing I say is advice....

  4. #234
    Senior Member ananda77's Avatar
    Join Date
    Jun 2004
    Location
    New Zealand.
    Posts
    1,465

    Default

    www.invetrics.com:- data point 09 February 2010

    (may adjust at market Open)

    www.stocktiming.com: -data point 09 February 2009-

    cash -data point 22 January 2010-

    Trader Update -data point 09 February 2010:

    ...the SPX 500 extended a corrective bounce up that started Friday 5 in late trading and headed into the *1073/*1080 range today before reversing to a Close below *1073 the low limit resistance of the Feb 4 congestion

    ...intraday trading was well supported around the *1060 level and as long as this level remains supported the market tone would be favorable to carry the index towards the Jan 22 congestion *1110

    ...failure in the *1060 range would move the index to the Feb 5 Low *1044 initially with sharp rebound potential to set the index up with a double bottom to go for the Jan 11 High *1151; penetrating *1044 would signal continued bearish potential with lower Lows ahead

    Long Term: THE BEAR
    Last edited by ananda77; 10-02-2010 at 10:11 PM.

  5. #235
    Senior Member ananda77's Avatar
    Join Date
    Jun 2004
    Location
    New Zealand.
    Posts
    1,465

    Default

    www.invetrics.com:- data point 10 February 2010

    (may adjust at market Open)

    www.stocktiming.com: -data point 10 February 2009-

    cash -data point 22 January 2010-

    Trader Update -data point 10 February 2010:

    ...a brief display of weakness, had the SPX 500 severe the *1060 support with an intraday Low *1059 so far and the current ongoing attempt to push higher into the *1080/*1090 congestion appears laboured with a down bias remaining

    ...failure in that range would indicate a readiness of the market to sell off down to the Feb 5 Low *1044 initially with sharp rebound potential to set the index up with a double bottom to go for the Jan 11 High *1151 (??eventually??)

    ...penetrating *1044 would signal continued bearish potential with lower Lows ahead

    Long Term: THE BEAR

    Kind Regards
    Last edited by ananda77; 11-02-2010 at 07:42 AM.

  6. #236
    Senior Member ananda77's Avatar
    Join Date
    Jun 2004
    Location
    New Zealand.
    Posts
    1,465

    Default

    www.invetrics.com:- data point 11 February 2010

    (may adjust at market Open)

    www.stocktiming.com: -data point 11 February 2009-

    cash -data point 22 January 2010-

    Trader Update -data point 11 February 2010:

    ...the SPX 500 overcame early weakness with *1060 support holding so far and the current ongoing attempt to push higher into the *1080/*1090 congestion appears ongoing; there should be enough strength above *1071 to trade into the range short term

    ...failure in that range would indicate a readiness of the market to sell off down to the Feb 5 Low *1044 initially and penetrating *1044 would signal continued bearish potential with lower Lows ahead


    Long Term: THE BEAR

    Kind Regards
    Last edited by ananda77; 13-02-2010 at 08:18 AM.

  7. #237
    Senior Member ananda77's Avatar
    Join Date
    Jun 2004
    Location
    New Zealand.
    Posts
    1,465

    Default

    www.invetrics.com:- data point 12 February 2010

    (may adjust at market Open)

    www.stocktiming.com: -data point 12 February 2009-

    cash -data point 22 January 2010-

    Trader Update -data point 12 February 2010:

    ...the SPX 500 overcame early weakness with *1060 support still holding so far and the current attempt to push higher into the *1086/*1094 congestion appears ongoing; there should be enough strength above *1061 to trade into the range short term; considering market internals however; there is big risk out there that *1060 support is on its way out...

    ...failure in that range would indicate a readiness of the market to sell off down to the Feb 5 Low *1044 initially and penetrating *1044 would signal continued bearish potential with lower Lows ahead

    Long Term: THE BEAR

    Kind Regards

  8. #238
    Advanced Member
    Join Date
    Dec 2001
    Location
    New Zealand.
    Posts
    1,936

    Default End of Week Chart.


  9. #239
    Senior Member ananda77's Avatar
    Join Date
    Jun 2004
    Location
    New Zealand.
    Posts
    1,465

    Default

    www.invetrics.com:- data point 16 February 2010

    (may adjust at market Open)

    www.stocktiming.com: -data point 16 February 2009-

    cash -data point 22 January 2010-

    Trader Update -data point 16 February 2010:

    ...after the SPX 500 successfully held the Jan 11 Low *1061 as support last Friday, the market rallied up today to test the *1090/*1097 range as expected; the institutional index of core holdings remians in a downtrend and liquidity inflows (Fed/Foreign) remains in contraction territory so far; risk is high for the market to continue its negative bias

    ...failure in that range would indicate a readiness of the market to sell off down to the Feb 5 Low *1044 initially and penetrating *1044 would signal continued bearish potential with lower Lows ahead

    Long Term: THE BEAR

    Kind Regards

  10. #240
    Legend peat's Avatar
    Join Date
    Aug 2004
    Location
    Whanganui, New Zealand.
    Posts
    6,437

    Default

    yeh its noticeable too that the 1095 area is the kijun sen (in pink) line of resistance using the ichi moku daily , kumo cloud above at 1110
    For clarity, nothing I say is advice....

Bookmarks

Posting Permissions

  • You may not post new threads
  • You may not post replies
  • You may not post attachments
  • You may not edit your posts
  •