-

Ichimoku signals seem to perform relatively poorly in the presence of a long-term uptrend. I wonder if it is no accident that it is most widely used in FX trading where longterm trends are practically non-existent. Just a theory.
Keep in mind that in the presence of a steady uptrend, it is pretty much impossible to beat a "Buy and Hold" approach anyway.
It is also possible that Ichimoku provides a superlative "one glance cloud chart or more appropriately Instant view of the balance chart" even though its specific Buy/Sell signals may be mediocre and can be outperformed by other systems. Maybe it works superbly on FX but not so well on stocks.
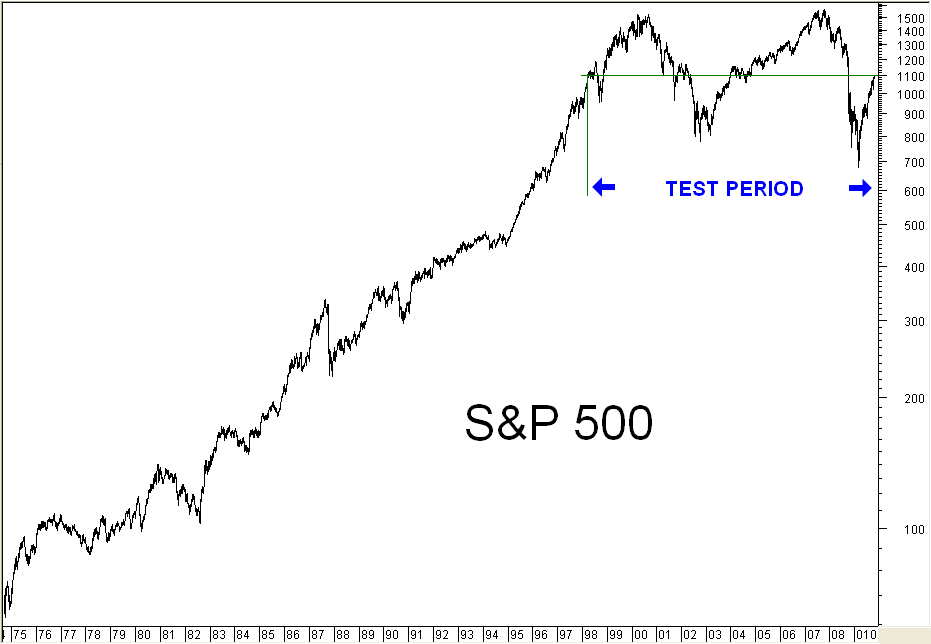
It is very difficult to evaluate this system when its performance characteristics vary so widely depending on the backtest period and what you are back-testing it against. In an attempt to remove the "longterm trend bias" I have been backtesting the SP500 on the period as marked in this chart, such that "Buying and Holding" gave zero return over nearly 12 years. Over this period, acting on all Ichimoku signals gave a loss of 25%, while acting only on Strong signals gave a gain of 20%.
Re the NZSX50 test data, to me it seems very odd indeed that by ignoring the "weakest" signals, the return collapses from an already poor 75% to just 32%. The conclusion that under these test conditions "weak" signals are no weaker than "strong" signals seems inescapable. Since this distinction is mediated by the relative position of the Kumo cloud, this in turn casts some element of doubt on the validity or worth of this concept when applied to Indices or stocks.
Time for me to begin backtesting some stocks, I think.
Afterthought :- Am I struggling to re-invent the wheel here? Does anyone know of any definitive, authoritative statistics as to the profitability of Ichimoku as applied to stocks?
-
 Originally Posted by Phaedrus

Afterthought :- Am I struggling to re-invent the wheel here? Does anyone know of any definitive, authoritative statistics as to the profitability of Ichimoku as applied to stocks?
Phaedrus, funny you should mention Ichimoku.
Firstly (sidetracking,)
Tonight (wed), while I was out and attended a Australian Technical Analysis Association monthly meeting and they had a guest speaker named Jake Bernstein giving a talk for about one hour. It was great and interesting night.
(Most of Jakes talk would certainly challenge much of the perceived factual technicals we use and certainly does give or add to perspective and/or perception).
Next point is, while I was there, afterwards, I met a fella there who actually also posts on HC, nick Paulbooma, and he actually uses Ichimoku and also stated to me the similar needs as yourself.
The problem with Ichimoku he says is both the learning material and a type of authority on it with available resources. Unlike how Steve Nison brought and made the Japanese Candlestick techniques to the west with alot of literature and meaning transposed, it made the training, knowledge parallel for Western Technials to associate with.
As you already know just a google search of Ichimoku there are sites that show some charts and briefly explain by definition what it is and kinda how to use it, but no actual real what I try to define as benchmark to.
I too am also keen to pursue more knowledge, techniques and resources on this, so when and if I come across some, I will send you a PM if you wish.
Cheers for now.
Add Edit:
Phraedrus, here is a link paul posted a little while ago: http://docs.google.com/present/view?...vite=923476245
Last edited by drillfix; 22-10-2009 at 03:31 AM.
-
The Technical SPX 500 Whereabouts -data point 20 October 2009-
Invetrics: Financial Insight and Market Timing Signals (may adjust at Market Open) -data point 21 October 2009-
Stocktiming: Technical Market Analysis -data point 20 October 2009-
 Institutional NET Buying and Selling Volume levels Institutional NET Buying and Selling Volume levels
 Long Term Trending Fed. Liquidity and Foreign Liquidity Inflows Long Term Trending Fed. Liquidity and Foreign Liquidity Inflows
 NYSE Momentum and Strength NYSE Momentum and Strength Momentum break below 100 translates into high risk for large down side move Momentum break below 100 translates into high risk for large down side move
 NYSE Down Volume NYSE Down Volume
US Economic Calendar -data point 21 October 2009
U.S. MBA mortgage applications index (actual) -13.7% (last) -1.8% /refis (actual) -16.8% /purchases (actual) -7.6%
Stock Market -data point 22 October 2009-
based on solid earnings data, market direction has been bullish from the start but returned to a more neutral trading stance in the meantime; although comfortably trading above the Oct 12 SPX 500 Peak *1079, remarkable is that continued selling into each daily rally continues
...still, current bullish potential could lift the market higher in the short term, but the bearish divergences apparent in the daily momentum would indicate, the market may want to take a breather possibly at or just above the 2007-2009 Break at *1122
...failing that zone will leave the market vulnerable to a 20% (+) sell-off during most of Q4 with the July Low *869 as the target; initially, a violation of SPX 500 *1079 at a Close would indicate a short-term top is in place and trading below the 50-day MA at *1038 would confirm a larger bearish shakeout is indeed underway
SPX 500 Hedge -data point2 October 2009-
 ...a seemingly tough call, but I stay with the current 'short' considering it is a SMALL price to pay for investment protection ...a seemingly tough call, but I stay with the current 'short' considering it is a SMALL price to pay for investment protection  ...could become an interesting Close ...could become an interesting Close
Market Commentary -data point 21-October 2009-
Countdown to the next crisis is already under way
Wolfgang Münchau
http://www.ft.com/cms/s/0/b82d2b96-b...nclick_check=1
David Rosenberg (Gluskin/Sheff) -data point 22 October 2009-
...The only thing we really learned in this extremely flashy, seven-month, 60%, nine-point multiple expansion-led rally, is that momentum investing never did become extinguished this cycle. It is really a fascinating commentary on human behavior that so many investors are lamenting about how the train has left the station without them. Please, give us a giant break! The train has left the station countless of times in the last 10 years but obviously none of these trips lasted very long because the reality is that equities have failed to generate any positive return over this time interval.
As for the here and now, there is another reality. Price gains in the stock market have generally occurred with low volume. There are limited buyers hedge funds and flash traders but no sellers (not yet, anyway). And, we saw in yesterdays decline that volume climbed across the board, and the number of high-volume selloffs is a major red flag that should not be ignored
Long Term: THE BEAR
_no guarantees and trading strategies are just ideas_
Kind Regards
Last edited by ananda77; 22-10-2009 at 08:28 AM.
-
quite a strong selloff at the close and , to me y'days falls started to look more impulsive. volatility would seem to be on the increase..... hmmmmm
For clarity, nothing I say is advice....
-
The Chikou span has crossed the price plot on the H4, although not yet on Daily.

Like any charting technique Ichimoku needs time and study. In addition to the general components the Japanese use shapes, counts and possibly something not divulged so far . I have read in Japanese texts that there it much more to the system, and that seems to be a closely guarded secret at the moment. After studying the method for a number of years I may have inadvertently discovered some of these 'secrets'. There may be more to find as I work daily with the charts
___________________

___________________
-
My crystal ball says 1200 more likely than 869. Time will tell ...
-
...despite the sell-off, the SPX 500 closed at *1081, above the Oct 12 SPX 500 Peak *1079; although the bulls have gone for a walk, their tails are still visible on the horizon
...the market remains jittery most likely based on news -data point 21 October 2009-
U.S. Credit Contraction Gaining Steam? The contraction in U.S. bank credit is accelerating just as broad metrics of financial market activity reflect diminished dislocation. And, reserve levels remain high despite an unwind in borrowed reserves, as nonborrowed reserves climb, while growth in the money stock and currency in circulation remains rapid. Are credit markets having an increasingly adverse effect on growth even as security market activity normalizes?
...this is not what the market wants to read, but further downside needs to be supported by taking out *1079 decisively which would make the 50-day MA ~*1041 the next downside target;
...trading above todays' SPX 500 intraday High *1101 would indicate a return to the bullish case  ...a tentative top at this stage ...a tentative top at this stage
arco:
...agree, there is more to a trading system than just looking at it
Kind Regards
Last edited by ananda77; 22-10-2009 at 12:02 PM.
-
Certainly the recent black candle on the hourly gives a bearish slant (perhaps short term to the TL). H4 Chickou is also through the plot and PA testing the Kumo.

___________________
___________________
-
Originally Posted by arco
Certainly the recent black candle on the hourly gives a bearish slant (perhaps short term to the TL). H4 Chickou is also through the plot and PA testing the Kumo.
...but would your system have warned you early enough to be 'short' last night before the sell-off; because the trading system I follow triggered 'short bias' (as in strategy) on -data point 16 October 2009- as anyone may clearly see on the trading platform (set day by day and not in hindsight, but before or at the market Open) -that remains the main agenda for me
...anyway, the bulls have ONLY 1 more chance to reverse the sell-down and that is to IMMEDIATELY (tonight or tomorrow night) rally back above todays' intraday High *1101
Kind Regards
Last edited by ananda77; 22-10-2009 at 05:19 PM.
-
___________________
___________________
 Posting Permissions
- You may not post new threads
- You may not post replies
- You may not post attachments
- You may not edit your posts
-
Forum Rules
|
|


 Reply With Quote


Bookmarks