-
17-12-2010, 09:29 AM
#711

ananda77 and Phaedrus your updates are most appreciated thanks
-
18-12-2010, 07:03 AM
#712

SEASONS GREETINGS. WISHING ALL A SUCCESSFUL NEW YEAR
Trader update -data point 17 December 2010-
...the SPX 500 appears to be consolidating between this weeks High *1247 and the December 16 Low *1233 and as long as the bullish breakout above the December 7 High *1235 remains intact, there is still potential for the market to stretch higher to take out the projected *1244/*1247 target in an attempt to challenge the daily 3-month upper channel resistance current *1273_September 2008 High *1274
...the index continues to be played in heavily overbought territory signposted by the ARMS index showing a market most overbought level in 68 years. 10-year Ts approaching 4%
...as a result, risk for a substantial pullback from *1250/*1274 over the next few weeks could target the lower channel support current *1194 as a minimum
...a bullish reversal from the *1194 level should set the market up for a multi-month rally with potential for a bullish break-out above *1250/*1267 in Q1 2011 with gains leading into the *1400 range possible
NEWRenaissance 2 http://www.csper.org/renaissance-20.html
-Bank Of North Dakota http://www.youtube.com/watch?v=r0rJW...eature=related 22 November 2010
-The Secrect of Oz http://www.zerohedge.com/article/sec...itical-complex 16 November 2010
-The End Of Liberty http://www.youtube.com/watch?v=AQv-sdMCClQ 12 November 2010
-Zeitgeist http://www.youtube.com/watch?v=1gKX9TWRyfs 03 November 2010
Kind Regards
-
24-12-2010, 07:31 AM
#713

Attachment 3128Jeez .... I thought this secular bear msrket would be over in 4 -5 years but looks like it might last another 10 years
Chart of the day again
Chart of the Day
Today's chart compares the inflation-adjusted S&P 500 performance during the current secular bear market (the inflation-adjusted S&P 500 peaked in 2000) to the inflation-adjusted S&P 500 performance following the peak of 1929 (i.e. during the Great Depression). For today's chart, both the 2000 to present S&P 500 (blue line) and the 1929-1949 S&P 500 (gray line) having been normalized to where each of their peaks begin in year zero and at the $100 level. What is of interest is not that both of these markets had declines and rallies of equal magnitude -- they did not. What is of interest is that both bear markets have tended to head in the same direction for approximately the same amount of time. For example, both bear markets suffered through a major decline during the first 2 1/2 years and then rallied sharply into year seven. Both markets then formed a major peak in year seven and declined sharply in the middle of the eighth year. Both bear markets have continued to follow a similar path following the eighth year trough. However, if this similarity in direction were to continue, the current stock market rally would need to close out in fairly short order.
http://www.chartoftheday.com/20101222.htm?T
Last edited by winner69; 24-12-2010 at 07:38 AM.
-
12-01-2011, 07:59 AM
#714

Trader Update -data point 11 January 2011-
...yesterday, the SPX 500 traded off the January 4 Low *1163_December 31 congestion *1256 support range but so far has been sold off below the January 6 High *1278 resistance
...still, above trading support *1256/*1263, chances are for the SPX 500 to attempt to eclipse *1278 in another attempt to head towards the *1300 Psych Barrier with current *1311 upper resistance looming overhead on the 3-mth daily set-up
...a sharp pull back is expected in the *1300/*1311 range, tolerating irrational exuberance up to *1340 before hedging a fully invested portfolio 100% (+)
...shake-out target: *1186
Kind Regards
Last edited by ananda77; 12-01-2011 at 08:03 AM.
-
13-01-2011, 07:08 AM
#715

Trader Update -data point 12 January 2011-
...the SPX 500 eclipsed the January 6 High *1278 in a decisive break-out, on track towards the *1300 Psych Barrier with current *1314 upper resistance looming overhead on the 3-mth daily trading set-up
...a sharp pull back is expected in the *1300/*1314 range, tolerating irrational exuberance up to *1344 before hedging a fully invested portfolio to 100% (+)
...shake-out target: *1186
Kind Regards
Last edited by ananda77; 13-01-2011 at 07:41 PM.
-
14-01-2011, 07:30 AM
#716

Trader Update -data point 13 January 2011-
...so far, the SPX 500 recovered from an early, intraday Low *1282, trading the flatline to consolidate yesterdays gains. Sustaining price above the January 6 High *1278 break-out, the index remains on track towards the *1300 Psych Barrier with current *1316 upper resistance looming overhead on the 3-mth daily trading set-up
Note: while Fed induced liquidity inflows create a boyant market, institutional selling action is short-term trending up, suggesting an impending correction
...a sharp pull back is expected in the *1300/*1314 range, tolerating irrational exuberance up to *1344 before hedging a fully invested portfolio to 100% (+)
...shake-out target: *1186
Kind Regards
Last edited by ananda77; 14-01-2011 at 09:07 AM.
-
15-01-2011, 05:23 AM
#717

...for updates: http://spx500dailyindextracker.blogspot.com
...updating becoming a lot quicker since writing, pasting, downloading, linking, archiving, etc. can all be done from one location. Appears to save an hour/day.
Kind Regards
Last edited by ananda77; 16-01-2011 at 08:23 AM.
-
18-01-2011, 09:18 AM
#718

-data point January 2011-
...SPX 500 long term view updated: http://www.spx500dailyindextracker.blogspot.com
Kind Regards
Last edited by ananda77; 19-01-2011 at 09:10 AM.
-
19-01-2011, 09:11 AM
#719
-
19-01-2011, 09:45 AM
#720
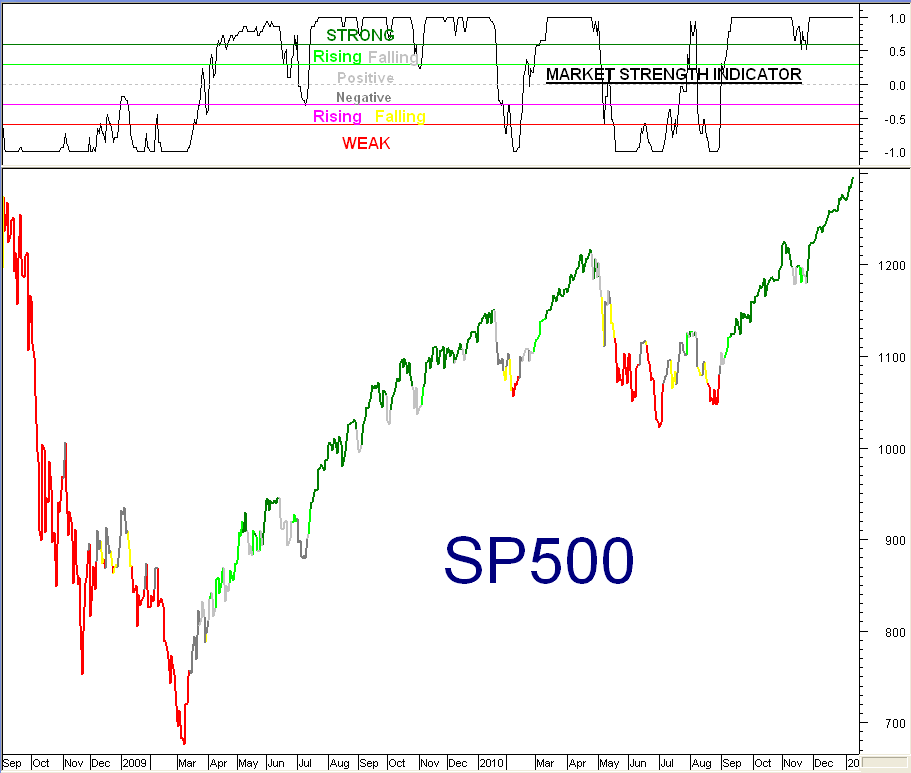
 Market Strength Chart Update Market Strength Chart Update
Generally speaking :-
See how it pays to be 100% invested when the plot is green.
See how yellow warns of increasing weakness.
See how it pays not to buy when the plot is red.
See how the best time to buy is when the plot is light green.

 Posting Permissions
- You may not post new threads
- You may not post replies
- You may not post attachments
- You may not edit your posts
-
Forum Rules
|
|

Bookmarks