-
13-09-2011, 11:19 PM
#871

 Originally Posted by Financially dependant

Hi Hoop, thanks for another great explanation of our current situation, I always value your posts....I am interested in why you call the 1120 support weak? With such high volume buying into the S&P at that level doesn't it give the support strength?? Always interested in your view (and anyone else who wants to chip in). Cheers FD.
Hi FD
Yeah... testing support under very high distributional volume and succeeding (not breaking) does show strength.
A quick simple way to gauge how strong a S&R level is, is by looking back through history and notice how many successful tests and retests that level has had without breaking. Yes volume is a factor as well...The strength of S&R levels can wax and wane over the years so a high frequency of successful tests without breaking in a more recent period would make the investor perceive the S&R level to be stronger than if the tests were say 10 years ago.
My orginal thinking when writing my last post was that the 1120 support was reached during the final stages of the freefall event and the market was exhausted by the time 1120 was reached at it sat on this 1120 level for a few days exhausted (buyers = much lesser sellers). The successful retest of the 1120 10 days later was pleasing and gave a slim hope for the bullish investors that the bottom may have been reached (double bottom).
I had another look going back to when 1120 S&R level first appeared in April 1998 onwards...yeah I may have been a little harsh on calling it a weak support, it has had some successful tests and it does seem to be a somewhat stronger level in mid 2010 even though the 1120 resistance held under lower than average volume...OK lets call it a medium strength 1120 support and up the chances of a possible bottoming process...however the chart still looks just as ugly as before .
-
14-09-2011, 08:09 AM
#872
Trader Update:
...with an intraday Low *1157, the market supported the September 12 Congestion High *1151 short term support and continued to rally into short term trendline resistance current *1175
...above current trendline resistance *1175, upside potential carries the index into overhead resistance current *1231 - watch out for violation of the current *1160 short term support
...failing *1175, the market turns bearish again - in that case, expect the September 6 Low *1136 to fly out the window, pushing the index for a second test of the bull level *1103 at a minimum
Kind Regards
-
14-09-2011, 12:51 PM
#873
im still feeling the market will grind higher from here in a corrective pattern ( lots of overlapping messy waves) before the market impulses lower .
looking at hoops chart if he changes the lower horizontal support line to a rising line it makes a channel ( bear flag) we will probably follow this up for a few
weeks in a 3 wave structure 1240 - 1260 then lower from here .
riding longs from a couple of days ago
Last edited by dumbass; 14-09-2011 at 12:53 PM.
-
14-09-2011, 10:06 PM
#874
Originally Posted by Hoop
Hi FD
Yeah... testing support under very high distributional volume and succeeding (not breaking) does show strength.
A quick simple way to gauge how strong a S&R level is, is by looking back through history and notice how many successful tests and retests that level has had without breaking. Yes volume is a factor as well...The strength of S&R levels can wax and wane over the years so a high frequency of successful tests without breaking in a more recent period would make the investor perceive the S&R level to be stronger than if the tests were say 10 years ago.
My orginal thinking when writing my last post was that the 1120 support was reached during the final stages of the freefall event and the market was exhausted by the time 1120 was reached at it sat on this 1120 level for a few days exhausted (buyers = much lesser sellers). The successful retest of the 1120 10 days later was pleasing and gave a slim hope for the bullish investors that the bottom may have been reached (double bottom).
I had another look going back to when 1120 S&R level first appeared in April 1998 onwards...yeah I may have been a little harsh on calling it a weak support, it has had some successful tests and it does seem to be a somewhat stronger level in mid 2010 even though the 1120 resistance held under lower than average volume...OK lets call it a medium strength 1120 support and up the chances of a possible bottoming process...however the chart still looks just as ugly as before .
Thanks Hoop....agreed the chart does look ugly
-
15-09-2011, 06:13 AM
#875
Trader Update:Hedged *1378
Trade: sold the SPX 500 *1202 - Target Range: below *1096 - Stop: *1187
...the SPX 500 bounced off the *1160 support with an intraday Low *1163 and extending above the short term trendline current *1176 into the *1187/*1192 resistance cluster - but labouring
...watch for an imminent bear strike failing the *1187/*1192 resistance cluster with expectation, the September 6 Low *1136 to fly out the window, pushing the index for a second test of the bull level *1103 at a minimum
Kind Regards
-
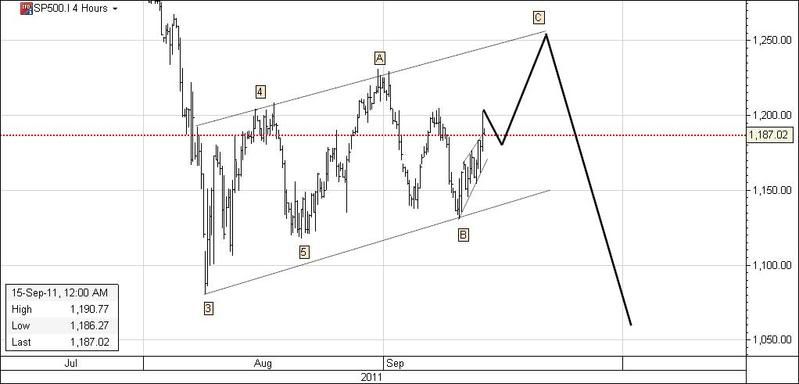
15-09-2011, 11:40 AM
#876
Last edited by Hoop; 15-09-2011 at 11:44 AM.
-
15-09-2011, 03:10 PM
#877
im not sure what your looking at hoop , looks like a tradeable bear flag to me.
-
15-09-2011, 08:58 PM
#878
Last edited by Hoop; 15-09-2011 at 09:22 PM.
-
16-09-2011, 07:39 AM
#879
Trader Update:
Hedged *1378
Trade: sold the SPX 500 *1202 - Target Range: below *1096 - Stop: *1187 - Exit Trade
...the SPX 500 respected short term support *1187 and extended its bounce off the September 12 Low *1136 into the August 21 Congestion High *1208 - short term support moves up to *1194
...potential for more upside into the August 31 Congestion High *1230/current overhead resistance *1235 - however, the index traded into short term oversold with momentum moving ahead of price - potential for a corrective move to affirm the *1183/*1178 support range
...the current rally remains on track above *1180 - failing the congestive clusters with a violation of the *1180 support signals high risk a bear strike is underway
Kind Regards
Last edited by ananda77; 16-09-2011 at 12:15 PM.
-
17-09-2011, 12:50 PM
#880
Trader Update:
Hedged *1378
...that and a declining oil price ahead of overhead key resistances plus FOMC meeting next week - tighten up on hedging strategies
Kind Regards
 Posting Permissions
- You may not post new threads
- You may not post replies
- You may not post attachments
- You may not edit your posts
-
Forum Rules
|
|


 Reply With Quote
 ( or a developing ascending rectangle bottom formation)


Bookmarks