-
24-07-2014, 03:01 PM
#7191

the other part of the bias is they hope readers will see their "triangle" and fear the bottom breakout with the yellow gold price line..In Practice sym triangle breakouts are near random (53% upside) when they do breakout they only have a 45% chance of reaching their target price..very piss poor trading forecast...traders don't like trading this pattern its very unreliable...but Arora doesn't think so....
Also another bias...look closely at the chart for June/July 2014 ..notice the big red coloured long rectangle boxed lines covering over the gold price (yellow) ...and the bottom line (orange) of the so-called sym triangle...notice that little yellow price line poking through the sym triangle line ...that's been Photoshopped or I'll eat my hat....the piece of yellow gold price line shown is at 1200 but in reality the gold price bottomed out at 1240.
also look at March 2014 yellow price line it appears to peak at 1310ish..in reality it peaked at ~1340 (close) the yellow price is covered by the red short sell box...
Imagine seeing these omitted bits and the gold chart instantly looks a lot better....Now Moosie that's why I said they are biased
Last edited by Hoop; 24-07-2014 at 03:06 PM.
-
24-07-2014, 04:43 PM
#7192
I hope to one day marry Scarlet Johansson & I have about as much chance of success as these guys, or maybe a little less! LOL
Hopefully you find my posts helpful, but in no way should they be construed as advice. Make your own decision. 
-
24-07-2014, 07:18 PM
#7193
Wouldn't be surprised to see a bit of volatility in gold tonight. Its looking a bit vulnerable & someone might have a crack. We could see a test of $1280, however I suspect all that would do is bring out the buyers, sparking a short covering rally. It is Thursday night after all, a night for action!
Last edited by Daytr; 24-07-2014 at 07:20 PM.
Hopefully you find my posts helpful, but in no way should they be construed as advice. Make your own decision.
-
24-07-2014, 07:28 PM
#7194
 Originally Posted by Daytr

Wouldn't be surprised to see a bit of volatility in gold tonight. Its looking a bit vulnerable & someone might have a crack. We could see a test of $1280, however I suspect all that would do is bring out the buyers, sparking a short covering rally. It is Thursday night after all, a night for action!
But wait!!!!!!!!!!!!!!!!!
Thursday night, Daytr our resident gold expert says it's always rally night.
But "we could see a test of $1280", a bet both ways as usual.
Last edited by Skol; 24-07-2014 at 07:32 PM.
-
25-07-2014, 10:39 AM
#7195
I think US stock markets may be running into a wall at this point. Over the last few months its really been M&A activity that has boosted the equity indices through record levels & even then YTD stock markets haven't performed that well on a percentage basis. Sure they are up & the return is reasonable & corporate profits are ok, but not in the context of the P.E. ratios. Now with the US economy showing signs of contraction, dare I say it recession how can the current valuations be viable? When M&A activity started to pick up around 8-9 months ago, this was a signal to me that equities are on their last spurt higher. All bubbles inflate bigger & go higher than one would anticipate, gold did the same thing when it peaked surging $300 in almost as many months. Perhaps we could see still one more surge, who knows however there is signs of weakness in the US housing sector, Ford just announced weaker than expected profits. Some bank profits are also weaker & then of course the influence of the Fed, reducing QE probably a lot quicker than most had anticipated. I'm no necessarily expecting a crash but a considerable & healthy correction. How will those M&A purchases look then? With interest rates at zero & if I am correct on equities, gold will get investor interest. Why not, the bond market is depressed & flooded, alternative investments are thin on the ground & hard assets, soft commodities & in particular gold should benefit.
Hopefully you find my posts helpful, but in no way should they be construed as advice. Make your own decision.
-
25-07-2014, 12:33 PM
#7196
Daytr's dreaming, but dreams are free I suppose. I keep getting messages on my phone telling me about US companies that are beating their estimated earnings.
SPDR GLD down 4 tonnes.
Last edited by Skol; 25-07-2014 at 12:58 PM.
-
25-07-2014, 01:45 PM
#7197
As an FB user I have noticed a massive increase in advertising & 'suggested' posts to the point that its getting annoying. Could be an issue for them, generation whatever is a fickle bunch
Hopefully you find my posts helpful, but in no way should they be construed as advice. Make your own decision.
-
25-07-2014, 02:22 PM
#7198
PE ratios below, the DOW & S&P aren't so much of a concern although if the US economy continues to contract then these to will be come an issue. But check out the Russell 2000 ! Ouch!
P/Es & Yields on Major Indexes Dow Indexes
Find Historical Data  | WHAT'S THIS? | WHAT'S THIS?
Thursday, July 24, 2014
| P/E RATIO |
DIV YIELD |
|
7/24/2014† |
Year ago† |
Estimate^ |
7/24/2014† |
Year ago† |
| Dow Industrial |
16.53 |
16.70 |
15.08 |
2.15 |
2.36 |
| Dow Transportation |
19.84 |
21.29 |
20.31 |
1.13 |
1.33 |
| Dow Utility |
22.38 |
25.48 |
17.01 |
2.71 |
3.00 |
^ Forward 12 months from Birinyi Associates; updated weekly on Friday.
P/E data based on as-reported earnings; estimate data based on operating earnings.
Sources: Birinyi Associates; WSJ Market Data Group
Other Indexes
Friday, July 18, 2014
| P/E RATIO |
DIV YIELD |
|
7/18/2014† |
Year ago† |
Estimate^ |
7/18/2014† |
Year ago† |
| Russell 2000 |
75.01 |
46.74 |
19.01 |
1.29 |
1.66 |
| Nasdaq 100 |
23.16 |
18.52 |
19.06 |
1.31 |
1.51 |
| S&P 500 |
19.54 |
18.43 |
16.44 |
1.91 |
2.10 |
Hopefully you find my posts helpful, but in no way should they be construed as advice. Make your own decision.
-
28-07-2014, 10:29 AM
#7199
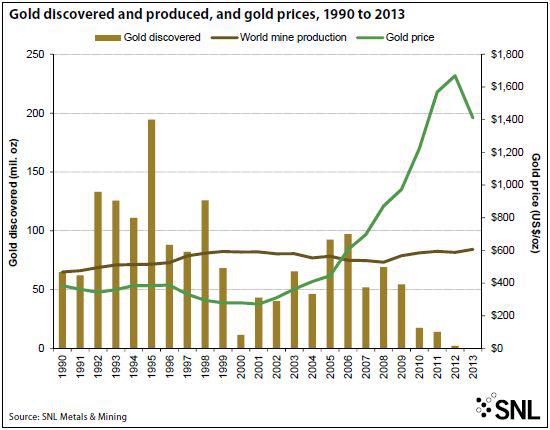
The Authors (see link below) suggest it takes about 18yrs from discovery to production ...so looking at the chart below it seems the gold price over the last 2 years may have fallen back due to the temporary oversupply (1995 peak)....If the chart figures are true then from now on we are (maybe) going to see at least a decade of lack of adequate supply of new (mined) gold. ..I would have liked SNL Mining and Metals to have supplied a longer term chart, one stretching back to say 1980 so I could see what the discovery numbers were in the lead up to 2001-2011 bull market cycle...With the limited chart information it is a bit difficult to tell how the future drop in new gold produced will affect the POG, as we don't the full influence of other factors such as the gold black economy, official amount of reserves, the unofficial stockpiles (+hidden stockpiles) etc...a longer chart period could've (not always) shed some light on the new gold produced correlated with GOP.
However this supply issue could solve the quandary as to why my charts are showing a possible bull cyclic reversal when most factors within golds current environment are negative towards the gold price (US$)
http://www.commodities-now.com/repor...-industry.html
Last edited by Hoop; 28-07-2014 at 10:38 AM.
-
28-07-2014, 05:17 PM
#7200
Tags for this Thread
 Posting Permissions
- You may not post new threads
- You may not post replies
- You may not post attachments
- You may not edit your posts
-
Forum Rules
|
|


 Reply With Quote
Bookmarks