-
04-07-2010, 06:50 PM
#771

 Originally Posted by karlos

You better get your house built fast JBmurc...........I own and operate a window repair business. FACT-- My main supplier of stock has just given me price increases of between roughly 10% on high volume glass and up to 45% on low volume. Ive owned this business for 9 years and this is the first price increase. Yeah-- I queried to suppliers and they stated it is due to increased prices from Asia  ...................PS Minor post from someone at grassroots level bearing the rising tidal wave of inflation 
Already paid 15% to get the contracted price fixed months ago damn council taking their time hoping to start soon ,Think we'll be glad we didn't wait much longer to sign up price wise
hoping the mortage broker can get me a HSBC loan 3yr 7.29% 6m 4.99% to pay for the other half of the build cost
"With a good perspective on history, we can have a better understanding of the past and present, and thus a clear vision of the future." Carlos Slim Helu
-
04-07-2010, 09:53 PM
#772
Originally Posted by upside_umop
Carefully or not carefully, gold stays static in real terms. Its not an investment as it has no intrinsic value...it does not produce cashflows. I guess you could say the cashflow is when you eventually sell it again. So, the intrinsic value is the price at which you sell it for in the future, discounting an appropriate rate (what you would use to to borrow for it). By rights, that intrinsic price would tend towards zero.
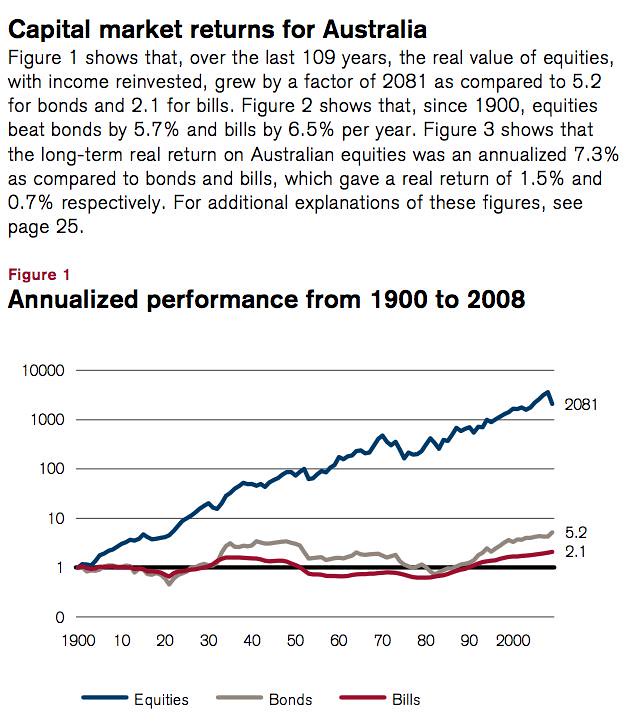
The Australian stock market in comparison, made real returns to the factor of 2000 over the years 1900 - 2009 (Credit Suisse report). That is, if you invested one ounce of gold in the broad Australian market in 1900, and pulled it out in 2009, you could have bought 2000 ounces of the shiny stuff back. Cool eh?
Look at what I found on a goldbug site, UU..
http://www.usgold.com/about-gold/
This doesn't match up with your comments, can you supply more details?
As the DOW is at 9686.48 , and gold is at USD$1210.6/oz, the ratio at the moment is almost exactly 8 (not 42?), and that chart implies it's heading lower.
A bit more looking finds for the last 10 years, an equivalent Aussie chart, see bottom chart on page 4.
http://www.globalspeculator.com.au/d...lusion_000.pdf
The current ratio has lowered over the last few days to just 2.96.
For these ratios to drop, equities have to lose value, and/or gold gets more expensive, relative to each other.
Last edited by elZorro; 06-07-2010 at 07:52 AM.
-
05-07-2010, 05:56 PM
#773
Hi Ez,
That's a nice chart, but again its the DOW. The DOW isn't the best performing index in the world over the long term (large caps).
The ASX has been the best performing index in the world, returning ~7.4% returns in real terms (inflation adjusted).
I'll post some more info later/tomorrow/the next day...busy busy
-
05-07-2010, 07:30 PM
#774
Originally Posted by upside_umop
Hi Ez,
That's a nice chart, but again its the DOW. The DOW isn't the best performing index in the world over the long term (large caps).
The ASX has been the best performing index in the world, returning ~7.4% returns in real terms (inflation adjusted).
I'll post some more info later/tomorrow/the next day...busy busy
These graphs are not that pretty or funny when you think about it.
Last edited by elZorro; 06-07-2010 at 07:54 AM.
-
05-07-2010, 08:52 PM
#775
Originally Posted by JBmurc
Already paid 15% to get the contracted price fixed months ago damn council taking their time hoping to start soon ,Think we'll be glad we didn't wait much longer to sign up price wise
hoping the mortage broker can get me a HSBC loan 3yr 7.29% 6m 4.99% to pay for the other half of the build cost
Kiwibank 3 year rate is 7.25%.
The banks are lowering their interest rates and on Stuff today mentions global interest rates are heading south.
No inflation.
-
05-07-2010, 09:41 PM
#776
Originally Posted by Skol
Kiwibank 3 year rate is 7.25%.
The banks are lowering their interest rates and on Stuff today mentions global interest rates are heading south.
No inflation.
How about 1 October when the GST increase kicks in?
-
06-07-2010, 07:41 PM
#777
-
06-07-2010, 10:53 PM
#778

Originally Posted by elZorro
These graphs are not that pretty or funny when you think about it.
How do you mean not pretty? I thought it portrays the trends quite well. Anyway, like I said, the DJIA is a poor performer.
As I said earlier, Australia provided real returns to the factor of over 2000.
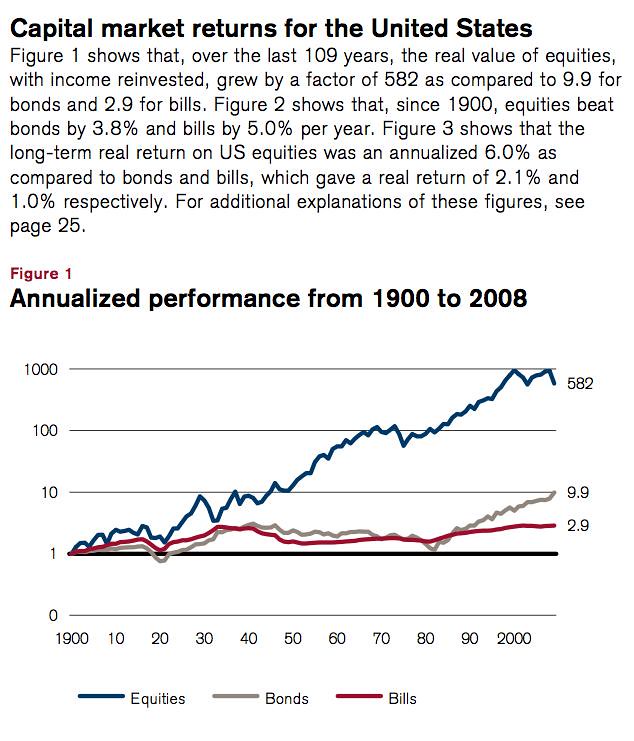
The price of gold from 1900-2008 has given a nominal return of around 3.6%. To get into real terms needs to be divided by a factor of 27.4. This means, that the real price of gold for 2008 in 1900 terms was =$871.96/27.39=$31.92. $18.96 in 1900 to $31.92 in 2008 means a real return of 0.48%. That was even after gold stayed static for over 200 years from 1717 with Isaac Newton of all people setting the price. All in all, gold increased by a factor of $31.92/$18.96=1.68 over the 108 years in real terms.
Comparing this against the the US capital markets, we get 592/1.68=351 times the real return of gold. Ie 35,100% more.
For the Aussie capital markets, its even better. 2081/1.68=1236 times the return of gold. Ie 123,600% more than gold. I'm assuming that Credit Suisse has already standardised against exchange rate movements, therefore no need to take these into account.
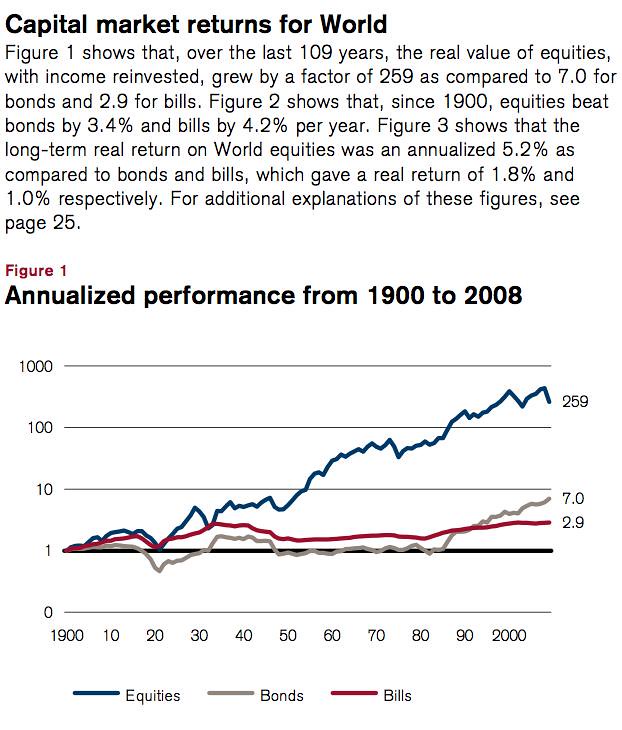
If you want it on a world scale...here is the performance of the 'world portfolio.' Yes thats right, the one that everyone hates....the ultimate diversified portfolio!
So yeah, you get the picture. Of course, past returns are no prediction of future returns. The USA is unlikely to grow the same rate as it did in the past. Yet, there will be many opportunities in the developing countries, kind of like how the USA et al was developing at the turn of 1900. I also understand that gold has continued to increase since the research, but to keep it consistent with their research, I kept it to 2008. The stock market was also looking pretty good then! Still, the returns are much better on the stock market (or so past experience has shown us).
Thumbs up to Credit Suisse for the hard work. Some excellent research there.
Last edited by upside_umop; 06-07-2010 at 10:54 PM.
-
07-07-2010, 11:12 AM
#779
Originally Posted by upside_umop
How do you mean not pretty? I thought it portrays the trends quite well. Anyway, like I said, the DJIA is a poor performer.
As I said earlier, Australia provided real returns to the factor of over 2000.
The price of gold from 1900-2008 has given a nominal return of around 3.6%. To get into real terms needs to be divided by a factor of 27.4. This means, that the real price of gold for 2008 in 1900 terms was =$871.96/27.39=$31.92. $18.96 in 1900 to $31.92 in 2008 means a real return of 0.48%. That was even after gold stayed static for over 200 years from 1717 with Isaac Newton of all people setting the price. All in all, gold increased by a factor of $31.92/$18.96=1.68 over the 108 years in real terms.
Comparing this against the the US capital markets, we get 592/1.68=351 times the real return of gold. Ie 35,100% more.
For the Aussie capital markets, its even better. 2081/1.68=1236 times the return of gold. Ie 123,600% more than gold. I'm assuming that Credit Suisse has already standardised against exchange rate movements, therefore no need to take these into account.
If you want it on a world scale...here is the performance of the 'world portfolio.' Yes thats right, the one that everyone hates....the ultimate diversified portfolio!
So yeah, you get the picture. Of course, past returns are no prediction of future returns. The USA is unlikely to grow the same rate as it did in the past. Yet, there will be many opportunities in the developing countries, kind of like how the USA et al was developing at the turn of 1900. I also understand that gold has continued to increase since the research, but to keep it consistent with their research, I kept it to 2008. The stock market was also looking pretty good then! Still, the returns are much better on the stock market (or so past experience has shown us).
Thumbs up to Credit Suisse for the hard work. Some excellent research there.
Thanks for all that work, UU.
I was a bit worried you had taken offence from the chart I found..but there are always two sides to the story.
I have printed your graphs out to hold as records. Very interesting. Points I noted:
1. World-USA-Aussie markets in increasing profitability. Hate to think where NZ would be.
2. By sticking with equities and reinvesting (I assume that is dividends, rights issues? etc) and getting compound returns, this is the result. Big gains over a 100 year period.
3.You can't compound gold. But it can double in price over a short period of time, you do have to time it right.
4. I was wondering where the graph was for savings in a bank a/c, compounded as a comparison. Hard to choose an interest rate I guess.
5. It would be interesting to look at these figures over a shorter period of say the last 10 years, as an investment window, it might show a different picture. But I do take your point over the long term. No argument.
6. You're also pointing out the benefits of buying and holding. I'm a bit more haphazard.
-
07-07-2010, 01:04 PM
#780
EZ
I shouldn't have too much trouble winning this weeks bet.
Tags for this Thread
 Posting Permissions
- You may not post new threads
- You may not post replies
- You may not post attachments
- You may not edit your posts
-
Forum Rules
|
|


 Reply With Quote

Bookmarks