-
 ANZ vs WBC ANZ vs WBC
Hey,
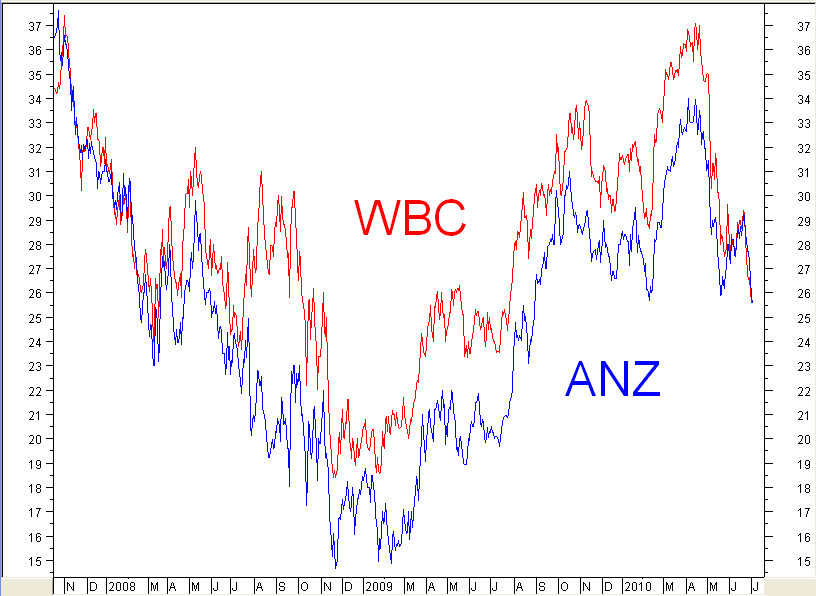
I was just wondering what thoughts are on investing in either of the two banks on NZX.
On DB, the depths are; WBC $29 and ANZ $35
Westpac shows better value PE wise compared to ANZ, though that could be due to due to the Asia expansion for ANZ and people willing to pay more...
What are your ideas?
-

Gonso56 split your money and have some of each
-

 Originally Posted by POSSUM THE CAT

Gonso56 split your money and have some of each
Especially as they're both at 26.00 !
But no imputation credit.
-

As far as valuing banks go I would have no idea but I'm trying to understand Technical analysis and wouldn't the indicators be telling you not to buy right at the moment.
Charts aside on a more fundamental basis isn't there some debate as to whether Aussie has a housing bubble and isn't overseas funding potentially going to become more expensive. What would these events do to the banks profitablity if they burst/occured.
-

(1) Don't do it Gonzo! Hold on to your money. Markets are falling worldwide - ANZ and WBC along with the rest. Wait. Who knows how far they will fall. If you have a habit of buying downtrending stocks, break it!
(2) What's the difference? Tweedledum and Tweedledee. You may just as well toss a coin.
(3) Why on earth would you buy both? It's not as if you would be diversifying!

-

 Originally Posted by GTM 3442

Especially as they're both at 26.00 !
But no imputation credit.
P told Gonzo 'don't do it' .... and both a re now just over $22
CBA got a muted response from a $6b profit ... these still to report ... and the world not a happy place for punters at the moment .... so P advice at $22+ to gonzo would still be 'don't do it' .... probably
Interesting times for the aussie banks
-
 Bad debt modelling for ANZ vs WBC Bad debt modelling for ANZ vs WBC
 Originally Posted by winner69

Interesting times for the aussie banks
A further comparison on the two NZX listed Aussie Banks.
Figures represent all of the respective ANZ and WBC businesses and dollar amounts are $A.
| ANZ |
|---|
|
Annual Impaired Asset Expense (A) |
Total Impaired Asset Provision (B) |
(A)/(B) |
Net Receivables (impairment included) |
(B)/(C) |
EBT (before impaired asset exposure) |
(A)/(D) |
|---|
| 2011 |
$1,237m |
$3,646m |
34% |
$400,953m |
0.9% |
$8,909m |
13.9% |
| 2012 |
$1,198m |
$4,538m |
26% |
$432,361m |
1.0% |
$9,192m |
13% |
| 2013 |
$1,188m |
$4,354m |
27% |
$487,618m |
0.9% |
$10,265 |
11.6% |
| 2014 |
$986m |
$3,933m |
25% |
$525,685m |
0.7% |
$11,294m |
8.7% |
| 2015 |
$1,179m |
$4,017m |
29% |
$574,255m |
0.7% |
$11,712m |
10.1% |
| WBC |
|---|
|
Annual Impaired Asset Expense (A) |
Total Impaired Asset Provision (B) |
(A)/(B) |
Net Receivables (impairment included) |
(B)/(C) |
EBT (before impaired asset exposure) |
(A)/(D) |
|---|
| 2011 |
$993m |
$4,414m |
22% |
$501,023m |
0.9% |
$9,507m |
10.4% |
| 2012 |
$1,212m |
$4,241m |
29% |
$518,686m |
0.8% |
$10,026m |
12.0% |
| 2013 |
$847m |
$3,949m |
21% |
$540,113m |
0.7% |
$10,619 |
8.0% |
| 2014 |
$650m |
$3,481m |
19% |
$588,824m |
0.6% |
$11,400m |
5.7% |
| 2015 |
$753m |
$3,332m |
23% |
$626,648m |
0.5% |
$12,109m |
6.2% |
And just for good measure, I will throw in the equivalent table for Heartland bank, even though that bank is not strictly comparable.
| Heartland Bank |
|---|
|
Annual Impaired Asset Expense (A) |
Total Impaired Asset Provision (B) |
(A)/(B) |
Net Receivables (impairment included) |
(B)/(C) |
EBT (before impaired asset exposure) |
(A)/(D) |
|---|
| 2012 |
$5.642m |
$27.426m |
21% |
$2,105.702m |
1.3% |
$29.337m |
19% |
| 2013 |
$22.527m |
$50.491m |
45% |
$2,060.867m |
2.4% |
$36.540 |
62% |
| 2014 |
$5.895m |
$16.381m |
36% |
$2,623.767m |
0.6% |
$57.416m |
10% |
| 2015 |
$12.105m |
$25.412m |
48% |
$2,887.482m |
0.9% |
$76.304m |
16% |
Points I note.
1/ Westpac have significantly lower impaired receivables, compared to total receivables. Furthermore Westpac is experiencing a steady reduction in the annual impairment balance sheet disclosure that the others are not experiencing.
2/ Heartland have a significantly higher annual impairment charge, relative to the total balance sheet annual impairment provision. A function of operating in a riskier loan space?
3/ ANZs write offs with respect to earnings are rather greater than Westpacs.
SNOOPY
Last edited by Snoopy; 14-02-2020 at 06:27 PM.
Watch out for the most persistent and dangerous version of Covid-19: B.S.24/7
-
 Industry Sector Risk FY2015: ANZ vs WBC vs Heartland Industry Sector Risk FY2015: ANZ vs WBC vs Heartland
The following division of loans is how the ANZ bank in Australia segments them. Loan categories from other banks have been adjusted in some instances to fit into this ANZ model.
| Loan Category |
ANZ Loan Book FY2015 (gross) |
ANZ Loan Book FY2015 (%ge) |
WBC Loan Book FY2015 (gross) |
WBC Loan Book FY2015 (%ge) |
HBL Loan Book FY2015 (gross) |
HBL Loan Book FY2015 (%ge) |
|---|
| Agriculture, Forestry, Fishing and Mining |
$39,610m |
4.7% |
$22,671m |
2.9% |
$576.577m |
17.8% |
| Business and Property Services |
$51,000m |
6.1% |
$74,793m |
9.7% |
$396.939m |
12.2% |
| Construction |
$7,609m |
0.9% |
$7,682m |
1.0% |
|
|
| Entertainment, Leisure and Tourism |
$11,797m |
1.4% |
$8,416m |
1.1% |
|
|
| Finance and insurance |
$230,710m |
27.5% |
$95,694m |
12.4% |
$377.318m |
11.6% |
| Government and Local Authority |
$52,524 |
6.2% |
$75,936m |
9.9% |
|
|
| Manufacturing |
$34,432m |
4.1% |
$18,501m |
2.4% |
$93.779m |
2.9% |
| Personal lending |
$330,925m |
39.5% |
$419,764m |
54.5% |
$1,397.003m |
43.1% |
| Electricity, Gas and Water Supplies |
$9,795m |
1.2% |
$7,445m |
1.0% |
|
|
| Retail & Wholesale trade |
$38,528m |
4.6% |
$22,774m |
3.0% |
$276.527m |
8.5% |
| Transport and storage |
$14,783m |
1.8% |
$13,895m |
1.8% |
$20.068m |
0.6% |
| Other |
$16,455m |
2.0% |
$2,358m |
0.3% |
$102.317m |
3.2% |
| Total |
$838,248m |
100% |
$769,929m |
100% |
$3,240.468m |
100% |
|---|
OK I have included Heartland because I know it has quite a few fans out there. It isn't really comparable as the loan bbok is less than 1/200th the size of ANZ or WBC. However, one thing to note is that in primary sector lending (agriculture, forestry, fishing and mining), in relative terms, the exposure of Heartland is five times that of a big Ozzie bank.
So accordingly Heartland is much more exposed to a primary sector downturn than the other two.
On page 11 of the WBC annual report this quote appears:
"Westpac has been underweight in the mining and mining services sector for some time."
The ANZ 'primary sector' exposure is significantly greater than WBC (4.7% vs 2.9%). But to say ANZ is 'overexposed' to mining and agriculture might be calling things too far. If anything ANZ are 'overexposed' to finance and insurance. A big chunk of that exposure (not shown on the table) is 'overseas' (which means outside of Australia and New Zealand in this context). Another bias in the ANZ Asian expansion is that Asian manufacturing loans outgross loans to Australian and New Zealand manufacturers combined. OTOH personal lending by ANZ is relatively much less in Asia.
From a Westpac perspective they are more into property and business loans, and also personal loans than ANZ.
What we have here between ANZ and WBC is two broadly similar companies, but with enough difference in emphasis to ensure that ANZ vs WBC is not quite the apples with apples comparison that some might think.
SNOOPY
Last edited by Snoopy; 23-02-2016 at 06:26 PM.
Watch out for the most persistent and dangerous version of Covid-19: B.S.24/7
-

Thanks Phaedrus, I did not buy. I would be happy with around $24 for WBC...
When it happens how can you tell if it is an uptrend, and not a small bounce back? Is it when its in combination with a positive market, or is it determined by the duration of any particular trend etc..?
-

 Originally Posted by gonzo56

I would be happy (to buy WBC) at around $24...
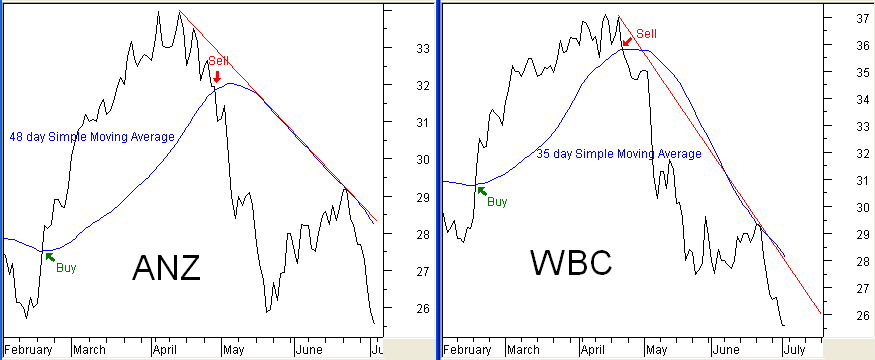
Well Gonzo, in my opinion it is not good to have a specific "buy" figure in mind. What you are trying to do is impose your aims/aspirations/wishes/hopes on the market. WBC is going to do what it is going to do, so you must to adapt to it. Your purchase plan must be flexible enough to accommodate market reality.
Scenario (1). WBC falls to $25, tracks sideways for a while, then starts rising - and keeps on rising. You have missed out on buying and feel bad.
Scenario (2) WBC falls to $24 and you buy. The shareprice continues falling, going right down to $19 before the downtrend reverses. You feel bad.
Scenario (3). You get impatient and buy now at $26 and the downtrend continues. You feel bad.
Scenario (4). WBC falls to $22 stays flat for a while then starts to rise. You buy at $23. You feel good.
Scenario (5). WBC eventually breaks above the trendline and/or moving average. You buy at $23. You feel good.
 Originally Posted by gonzo56

When it happens how can you tell.....
Entire books are written on just that topic, Gonzo. To give you some idea of the most basic Technical Analysis, here are 2 simple charts. The simplest trend indicators are trendlines (red) and Moving averages (blue) The idea is to buy if/when price action breaks above either of these.

More sophisticated systems would probably get you into these stocks a bit earlier but you need to learn to walk before you run. Keep it simple to start with.
Tags for this Thread
 Posting Permissions
- You may not post new threads
- You may not post replies
- You may not post attachments
- You may not edit your posts
-
Forum Rules
|
|


 Reply With Quote


Bookmarks