-
06-05-2011, 01:05 PM
#201
Member


anyone got any views on FPH - there results are out soon.
They are in a portfolio I look after as a long term growth play - but TBH i have little feeling for the stock. Be great to get peoples viewpoints both fundys and techies as to whether I should exit and pursue other more lucrative opportunities.
-
06-05-2011, 02:56 PM
#202
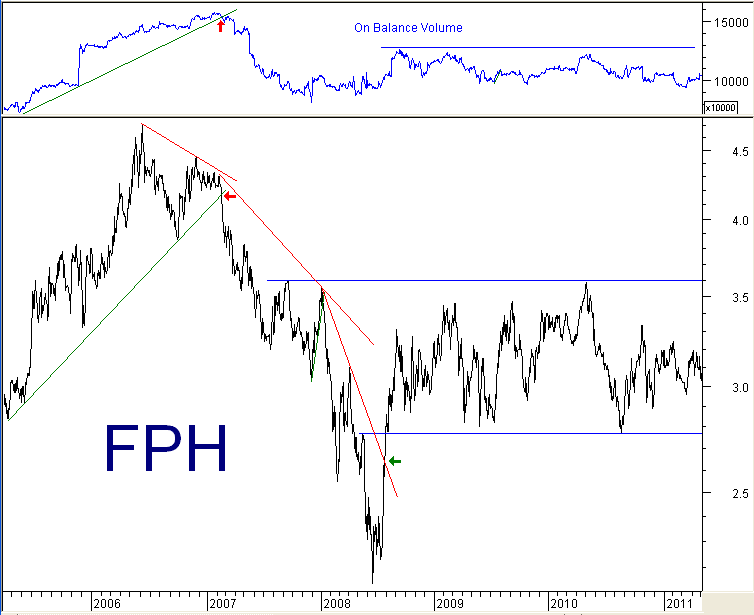
 FPH Chart FPH Chart
Modandm, FPH has been crabbing sideways in a $2.80 - $3.60 trading range for nearly 3 years, so far. The OBV is flat, so there is no indication of any accumulation OR distribution. Stasis. Who knows how long this will continue for? Theoretically, FPH "ought" to break out to the Upside, but life is too short to hold stocks like this.
I had to smile when I saw that you have this as a "long term growth play" - I think it needs to be reclassified - an income stock, perhaps?
I reckon you have been patient enough - too patient, in fact. Dump FPH and get something else when the time is right.

-
06-05-2011, 04:42 PM
#203

Phaedrus.Thanks for the chart up date and comments.
-
08-05-2011, 03:32 PM
#204

Looking at P's chart I noticed that FPH is not strictly in a traditional trading range (Rectangle formation)..so if not a rectangle it has to be something else, perhaps a flat shaped diamond?
Diamonds aren't necessary a traders friend ....If we (NZX) were in a cyclic bear market this Diamond top would be considered a reasonable reliable reversal formation, however we are in a Bull cycle and the bearish formation has to fight the upward forces of that bull market and therefore the diamond top formation is unreliable.
A diamond top is characterised by the price trend leading into the diamond from the bottom of the formation.
Other characteristics include a falling volume trend or a dome or saucer...initially traders come in when there are higher highs and lower lows (megaphone) however volume dries up when the pattern turns to lower highs and higher lows thus creating less reward. At some point in the later stages of the diamond the reward is unattractive and the traders put the Stock into "who cares a sh1t" category. Sometimes the stock may create an interest when investors use a short-term chart and just see the lower high higher low symmetrical triangle and so get an inverted dome (saucer) but still declining volume pattern.
As one can see the diamond is nearly completed..so what to do???
Nothing until you can see which way it is going to breakout...and even then the break could be unreliable in this bull market cycle.
I have charted the possibilities with Target Prices both ways which have only a 50% chance of reaching...notice the target prices are not that attractive due to the flatness and width of the diamond formation and the price has to go through a strong resistance level going up and a support level going down so again added doubt to reach its target price.
Using the risk and reward method at breakout it shows equal risk to equal reward on an unreliable direction of the breakout. A trading investor would at least need a 70% or higher reward in this situation and as this breakout is an equal 50 -50 the smart investor will put FPH into the "who cares..." basket, ignore it and move on to the next opportune stock.
Its pity really as FPH use to be one stock to watch especially during the last bear market when it showed potential to shine when the Healthcare market was seen to be a safe haven from the bear world-wide....now at this point of time, it is only of an academic interest to the formation Chartists.
If you want in depth info in Diamond formations go to Bulkowski's The pattern Site

-
09-05-2011, 12:01 AM
#205
Member


thanks to phaderus and hoop for their comments.
Yes it has been doing alot of nothing - its in my dads portfolio honestly - which im now helping with, and he far more patient than I.
I guess there needs to be some fundamental catalyst to break this company out of its anemic crabbing and get a trend going. Lets hope the trend is up.
I think I will wait for the results announcement and presentation then make a call from there. Hopefully the high NZ$ is only hurting them as expected and factored in already - no nasty surprises please.
Guess the question is what else to buy nzx...
-
09-05-2011, 12:51 PM
#206
Member


modandm - FPH is extremely sensitive to the NZD/USD exchange rate given 98% of its earnings are derived offshore, predominately in USD and to a lesser extent EUR. Yes, they do actively hedge but my guess is they only have limited cover in FY12 and the current rate of around 79c will be hurting them. So the catalyst you are looking for is a big drop in the NZD/USD rate. ie. to 70c and below.
I'd love to see a graph of FPH vs NZD/USD (or inverse of NZD/USD) over the past few years to see how close the correlation is. Mr P - are you able to oblige please?
Unlike you, I do expect a nasty surprise when they announce their FY11 result later this month. They gave guidance back in Sep 2010 of $65 - $70m NPAT if the x-rate remains at around 71c. I expect the actual figure will come in at the lower end of this range given the higher-than-expected x-rate since then.
But more importantly, where will the company's FY12 profit guidance be pitched at? We know that the sleep apnea markets are growing at around 15% pa. But we also know that the company's NPAT sensitivity is around +/- $1.5m for every 1% movement in it's 'basket of currencies'. If FPH can grow it's top line at 15% and the currency remains at 79c, then a very crude calculation gets FY12 NPAT of around $60m (assuming $65m FY11 NPAT x 1.15 - (79/71 - 1)*100 x $1.5m + $2m for hedging gains and Mexico efficiences). I don't think the market will be happy with FY12 NPAT guidance of anything lower than $65m.
At the current share price of $3.07, and assuming NPAT of $65m and EBITDA of $123m, FPH is currently trading on some reasonably rich multiples:
PE = $3.07 / ($65m/520.5m) = 24.6x
EV/EBITDA = ($3.07 x 520.5m + $77m net debt) / $123m = 13.7x
Gross yield = 12.4c / 307c / 70% = 5.8%
Without a drop a NZD/USD I can't see FPH going up.
Last edited by Catalyst; 09-05-2011 at 01:01 PM.
-
09-05-2011, 02:14 PM
#207
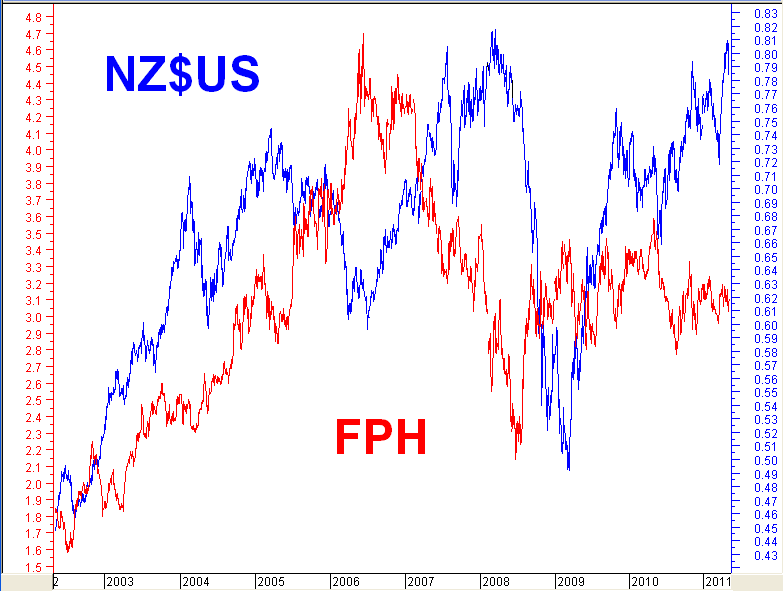
 FPH vs NZ$US FPH vs NZ$US
Here you are Catalyst - what do you make of it?

-
09-05-2011, 04:48 PM
#208
Member


Thank you for the chart Phaedrus.
What do I make of it?
Pre-2006 : Fairly high positive correlation between NZD/USD and FPH. FPH had some quite attractive hedging in place during this time. From memory, in 2002 and 2003 they locked in rates below 50c for the next few years so the company's performance in FY04, FY05 and FY06 was largely uneffected by the appreciation in the NZD/USD.
Post-2006 : Fairly high negative correlation. The attractive hedging was gone by this stage and the company's earnings were largely exposed to the spot NZD/USD. The company did lock in some quite good currency rates for FY10 and to a limited extent FY11 when the NZD dived during the GFC but I don't think they have too much attractive cover for FY12 and beyond.
Phaedrus, are you able to post the same chart from 2006 onwards please? Cheers
-
10-05-2011, 08:03 AM
#209

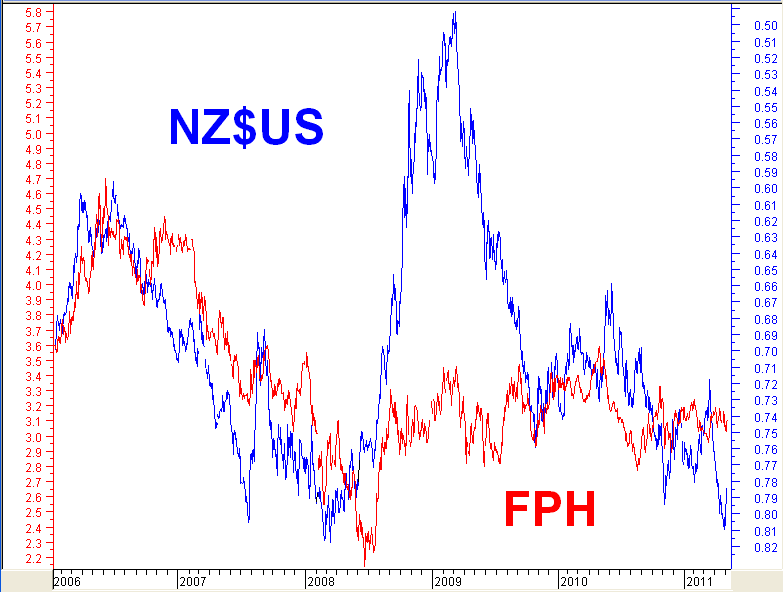
I've reversed the NZ$US scale for this one, Catalyst.
Strange. Again, there is a good correlation, and then ....... there isn't!

-
11-05-2011, 09:23 AM
#210
Member


Thanks again Mr P. Apart from that 1-year period between mid-2008 and mid-2009 when the kiwi dollar momentarily dived to below 50c, I think the chart generally shows a strong inverse correlation between FPH and the NZD/USD, especially during periods when FPH haven't got a lot of attractive hedging in place.
One further charting question for you please, is the NZD/USD trend still up or has it turned? Cheers
Tags for this Thread
 Posting Permissions
- You may not post new threads
- You may not post replies
- You may not post attachments
- You may not edit your posts
-
Forum Rules
|
|


 Reply With Quote


Bookmarks