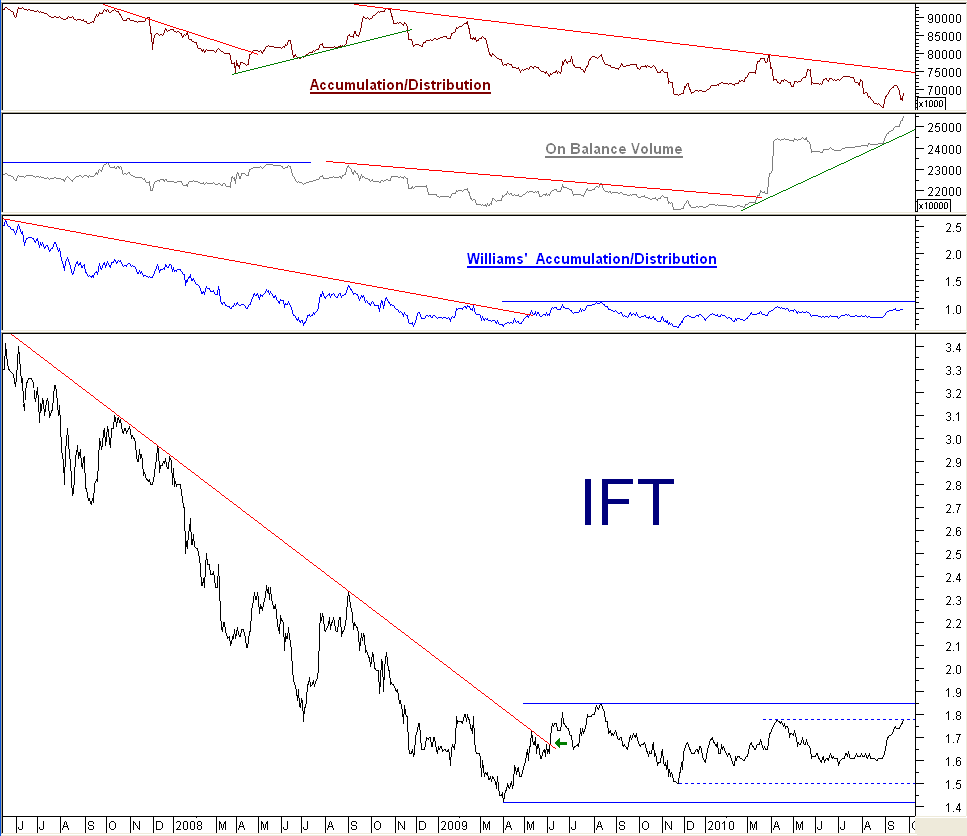
IFT remains in the trading range that it has been in for a long time. On Friday IFT closed at a previous resistance level, but a break above this should not generate excitement. A break above $1.85, though, would mean the end of the trading range and the end of a downtrend that has run for
years.
Note the (unconfirmed) "buy" signal at the trendline break (green arrow). A reminder (just in case you needed one) that the break of a downward trendline does not necessarily mean the beginning of an uptrend or even the end of the downtrend.
The 3 plots at the top of the chart are commonly used volume indicators. What is interesting here is just how different they are. Right now the OBV is rising, the Williams' A/D is flat and the A/D is falling. Which one are we to believe? Given such a variation, the answer is
none of them. Nevertheless with IFT over the past few years it is quite obvious that the Williams' version of the A/D oscillator has proved to be superior to the OBV that I generally use.
Personally, I am very happy to be out of IFT at the moment. There is no telling how long it will continue to crab sideways like this.

Bookmarks