-
 Long-term STU Chart Long-term STU Chart
 Originally Posted by Yankiwi

STU from $2.50 to $3.00 in a week on lightish volume. Well above the MA100 now. It still appears to me to be in a mid/long term downtrend with a possible short term break out. Any wiser (than my own) TA thoughts?
There is not much that can be added to your comments, YK. You have covered the important facts such as the low volume - today's big rise to $3 was on just 1911 shares, for example.
I have not plotted my usual raft of supplementary indicators on this chart because STU is in a consolidation zone and in such circumstances trend indicators just give a series of contradictory signals. The 100 ma cross you mention has no significance - price action has risen above it 6 times so far during the course of this wide trading range.
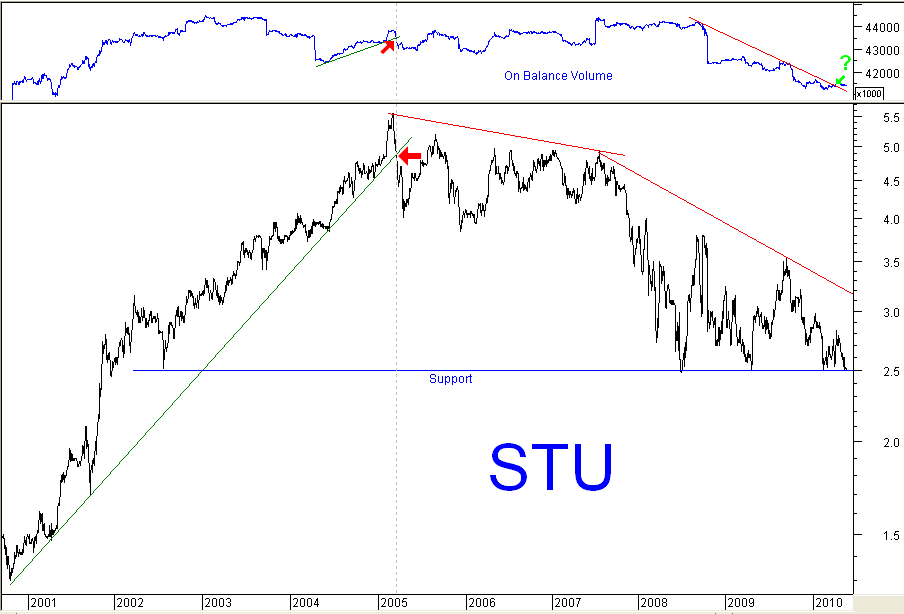
For STU to break its longterm (4 year) downtrend, the shareprice would need to go above the Resistance at $3.80. That is well above current price action and would mean a fairly late entry. The break of the current confirmed short-term trendline would make for a more timely signal for those wanting to buy.
I would see a retreat to the support at $2.50 as a buying opportunity.
The break of the 5 year uptrend gave a timely trendline-break Sell signal, getting you out of STU before you gave a lot of profits back to the market. A nice example of why a staunch "buy and hold" approach is a bad idea!

-

IMO it's just a matter of time before STU's major shareholder takes them out.
Now would be a good time to do that but doubtful whether Onesteel ( or is it Bluescope?) has the cash to do so.
Meanwhile, it's a nice little divvy payer with potential for a bit of capital gain eventually.
-

And me at $2.53. Haven't looked at it today. Too busy buying and selling other stuff!
-
 STU Chart STU Chart
 Originally Posted by Yankiwi

It's wonderful to see that long term support has held firmly at $2.50.
Yes, it really is remarkable how that level has held strong over the years - especially through the current turmoil. I don't think there are any really safe havens, but if there were, STU would have to be on the list.
There is no great insight to be gained from the chart apart from viewing the support. It's good that the OBV seems to have stopped falling, but the recent trendline break "buy" signal was caused by the OBV crabbing sideways rather than by a definitive rise so it should be ignored.
If I were in your situation, I would be inclined to hold on to my $2.57 - $2.58 STU and delay buying more until the global situation settles a little. This is a very good time to be holding cash. Here's a thought for you - maybe when you do buy, you would do better investing in something that had been severely beaten down, rather than adding to your STU investment - a stock you already hold at a good price and one that has not been hammered.

Tags for this Thread
 Posting Permissions
- You may not post new threads
- You may not post replies
- You may not post attachments
- You may not edit your posts
-
Forum Rules
|
|


 Reply With Quote


Bookmarks