-
 Chart Update Chart Update
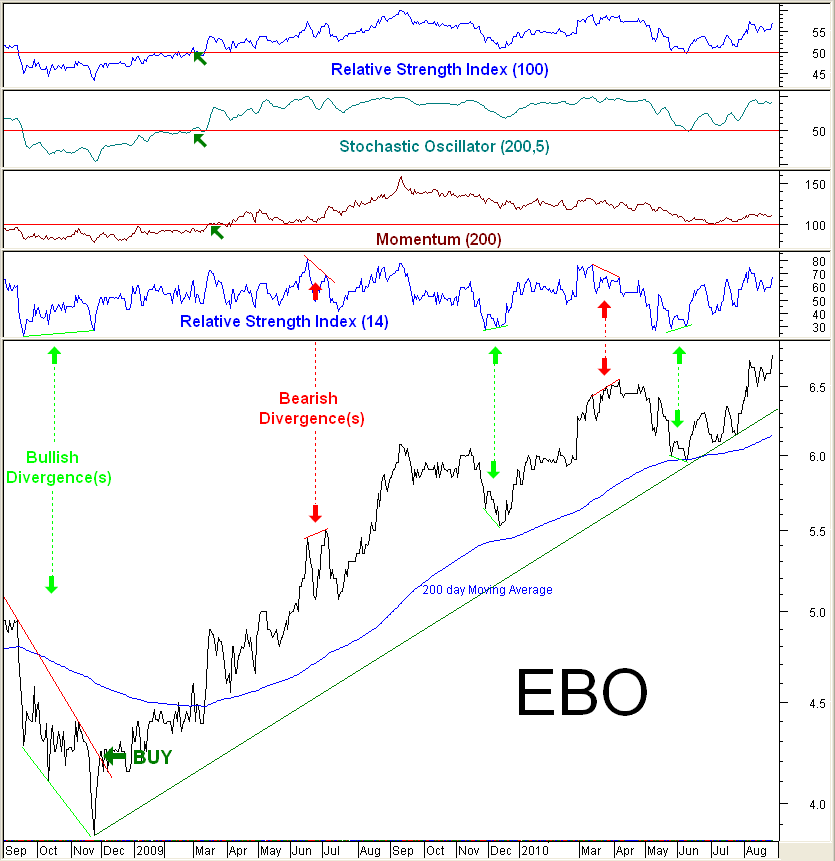
This chart features Bullish and Bearish divergences. These occur when prices and oscillators move in different directions instead of in tandem as they usually do. See how every divergence presaged a significant "medium-term" reversal. (Though not every significant reversal is accompanied by a divergence.) Divergences provide excellent entry/exit signals for short-term traders and also mark good points for longer term investors to add to (or reduce) their holding should they wish to.
The 14 day RSI as used to provide short-term signals can also provide excellent medium/long term signals simply by increasing the period, in this case to 100 days.
A 200 day Moving Average is commonly used by long-term investors to keep them on the right side of major trends. Conservative indicators such as this and the 3 oscillators at the top of the chart are slow to get you into stocks and slow to get you out of them, but they are a lot less likely to flick you out of an ongoing uptrend on any transient weakness.

Tags for this Thread
 Posting Permissions
- You may not post new threads
- You may not post replies
- You may not post attachments
- You may not edit your posts
-
Forum Rules
|
|


 Reply With Quote

Bookmarks