sharetrader
Results 1 to 10 of 1254

Hybrid View

  1. #1
    Member
    Join Date
    Sep 2010
    Posts
    64

    Default

    Thanks Phaedrus. I see almost all my indicator periods are double yours. Guess I still have some more learning to do, probably should have kept the times shorter in hindsight.
    Last edited by arcticblue; 20-06-2011 at 09:18 AM. Reason: Fix spelling mistake

  2. #2
    Advanced Member
    Join Date
    Dec 2001
    Location
    New Zealand.
    Posts
    1,936

    Default

    AB, you can do a lot better than simply copying my SKL parameters as charted. Those were just round figure "legacy" values that I had used in a few previous SKL charts. The object here was to monitor that big 2010 uptrend with a view to generating timely sell signals when the uptrend weakened and ended.

    By the end of June 2010 we had a nice clear pivot point (circled) on which to base our indicators. At this stage we could draw in an unconfirmed trendline and select indicator values appropriate for that uptrend. Note that for the RMI, default values were just fine. In August, the trendline was confirmed. Last month, the trendline was broken but this was unaccompanied by any other confirmatory Sell signals. These came a few days later when 4 more indicators all triggered on the same day.
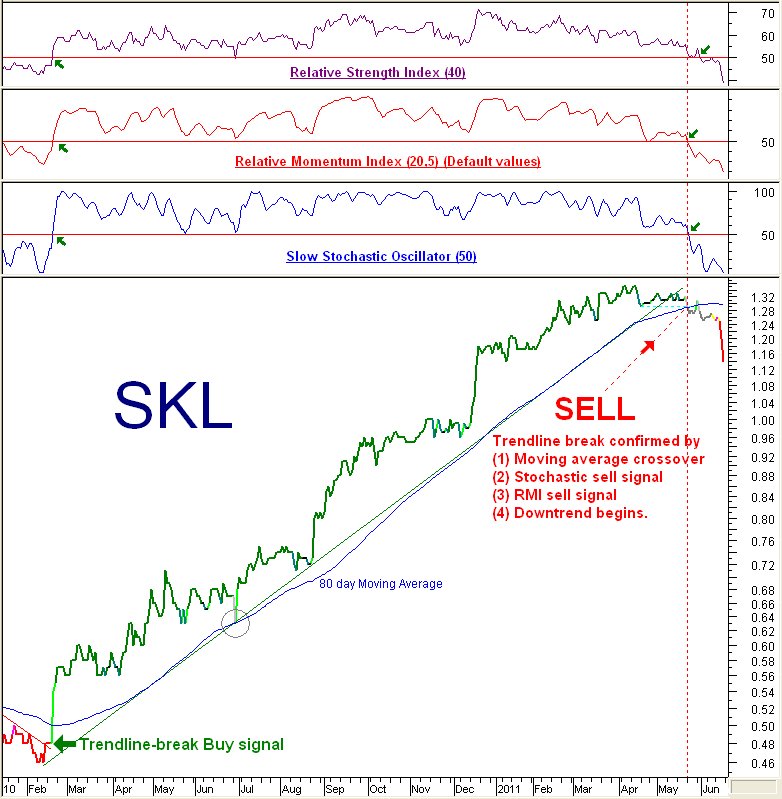


    In short, you can make an excellent case for using shorter periods than those initially shown, but I am a bit puzzled as to why you were using indicator periods that were double mine, AB. There is such a thing as being too conservative!

    You don't need all this fancy TA of course. An exit when the uptrend ended and the downtrend began (when SKL made a lower Low after a lower High) would have got you out at exactly the same price and locked in a very good profit. SKL has dropped quite sharply since then.

  3. #3
    Legend Balance's Avatar
    Join Date
    Feb 2003
    Posts
    21,848

    Default

    Quote Originally Posted by Phaedrus View Post
    AB, you can do a lot better than simply copying my SKL parameters as charted. Those were just round figure "legacy" values that I had used in a few previous SKL charts. The object here was to monitor that big 2010 uptrend with a view to generating timely sell signals when the uptrend weakened and ended.

    By the end of June 2010 we had a nice clear pivot point (circled) on which to base our indicators. At this stage we could draw in an unconfirmed trendline and select indicator values appropriate for that uptrend. Note that for the RMI, default values were just fine. In August, the trendline was confirmed. Last month, the trendline was broken but this was unaccompanied by any other confirmatory Sell signals. These came a few days later when 4 more indicators all triggered on the same day.


    In short, you can make an excellent case for using shorter periods than those initially shown, but I am a bit puzzled as to why you were using indicator periods that were double mine, AB. There is such a thing as being too conservative!

    You don't need all this fancy TA of course. An exit when the uptrend ended and the downtrend began (when SKL made a lower Low after a lower High) would have got you out at exactly the same price and locked in a very good profit. SKL has dropped quite sharply since then.
    Notice how it's all historical?

    I have yet to see a pro-active 'buy' or 'sell' signal posted by TA.

    Beautiful 20/20 hindsight - everytime.

  4. #4
    percy
    Join Date
    Oct 2009
    Location
    christchurch
    Posts
    17,329

    Default

    [

    Beautiful 20/20 hindsight - everytime.[/QUOTE]

    Look forward to more foresight from you?

  5. #5
    Legend Balance's Avatar
    Join Date
    Feb 2003
    Posts
    21,848

    Default

    Quote Originally Posted by percy View Post
    [

    Beautiful 20/20 hindsight - everytime.
    Look forward to more foresight from you?[/QUOTE]

    Big volume plus a uptrending share price?

    Buy signal, surely.

  6. #6
    percy
    Join Date
    Oct 2009
    Location
    christchurch
    Posts
    17,329

    Default

    Quote Originally Posted by Balance View Post
    Look forward to more foresight from you?
    Big volume plus a uptrending share price?

    Buy signal, surely.[/QUOTE]

  7. #7
    percy
    Join Date
    Oct 2009
    Location
    christchurch
    Posts
    17,329

    Default

    Quote Originally Posted by percy View Post
    Big volume plus a uptrending share price?

    Buy signal, surely.
    [/QUOTE]

    Well I hope so.

Tags for this Thread

Bookmarks

Posting Permissions

  • You may not post new threads
  • You may not post replies
  • You may not post attachments
  • You may not edit your posts
  •