...inflowing liquidity levels remained positive but are weakening throughout the last few days. In essence, Mrs. Market still in control.
The extreme danger signs are solely coming from traditional, technical set-ups, which iMHO are more snd more useless........
...technical set ups?? ...you lost me Ananda.........Not hard to do, I blame my problem on my lack of IQ genes
...technical set ups?? ...you lost me Ananda.........Not hard to do, I blame my problem on my lack of IQ genes
sorry Hoop most likely my mistake
Like according to the NYA 2012 - 2014 price channel or the long term (yearly price) expanding wedge of the Dow, this market is super risky and upside ptential is extremely limited
But llook at the VIX - no worries at all - and no matter what, liquidity inflows remain positive
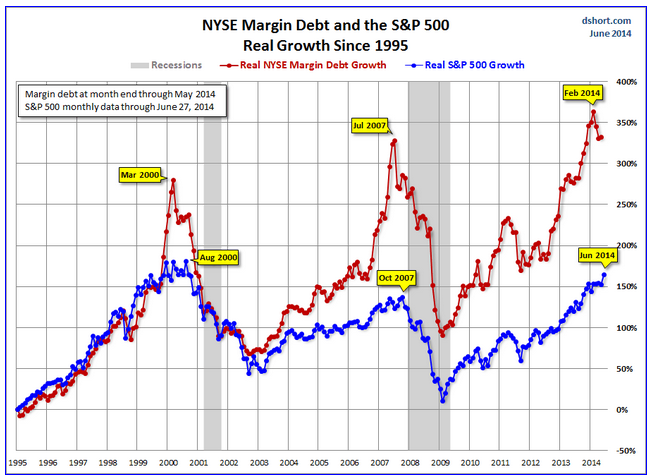
Forgetting about media noise and stepping back to take in a bigger view sees the S&P500 for what it is Ananda....a runaway bull market ....The chart below needs no squiggly lines, its a solid uptrending index so no problems with the medium/long term technical side of things..
However, although one can argue with the fundamental aspects of whether the market is grossly overvalued or not, it is actually Market physics which is starting to show the problem ..there is just not enough money left in the system to keep the market momentum going.... It is all invested..At the moment it just doesn't pay to be out of the market.
The demise of a bull market cycle is usually due to its own overwhelming success..eh?
Then you have Financial physics playing a role and having a compounding affect on the Market...the tightening of Monetary and Fiscal policies adding to the woes of not enough available money...a double whammy effect
The price one pays when the economy booms..eh?
The chart below tells the story...if history repeats then there are black clouds forming on the horizon.. US Equity bust around October with US recession next year??????? or will it be "different this time" with the "successful" taste of regulation & unconventional QE the FED would step back in and warp the markets more so...
Three months ago there were 498 stocks above 200MA and 2 below
Yesterday there were 387 above and 115 below
And the number of stocks reaching year highs was 25 today compared to 204 three months ago
Sign of general weakness?
I have no idea
Yep...68% of stocks on NYSE above MA200 (see NYA200R chart below) ..hasn't been this low since the weakness during April - May 2014.
My correction indicator triggered 3 out of 4 correction warning signals during the bull hype when the S&P500 was making new record highs..strange.. huh?... Fewer and fewer stocks keeping the index rising is not a good sign (divergence)
My Correction Indicator has now triggered all the necessary 4 indicators to complete the correction warning....The last to go was the EMA50 this morning.
My Correction Indicator has now triggered all the necessary 4 indicators to complete the correction warning....The last to go was the EMA50 this morning.
Hoop, recent breaches of the EMA50 having been decent buying opportunities. Why not this time? What are the other 3 indicators?
What confirmations would you look at to go long again?


Originally Posted by ananda77

...technical set ups?? ...you lost me Ananda.........Not hard to do, I blame my problem on my lack of IQ genes


 Reply With Quote


Bookmarks